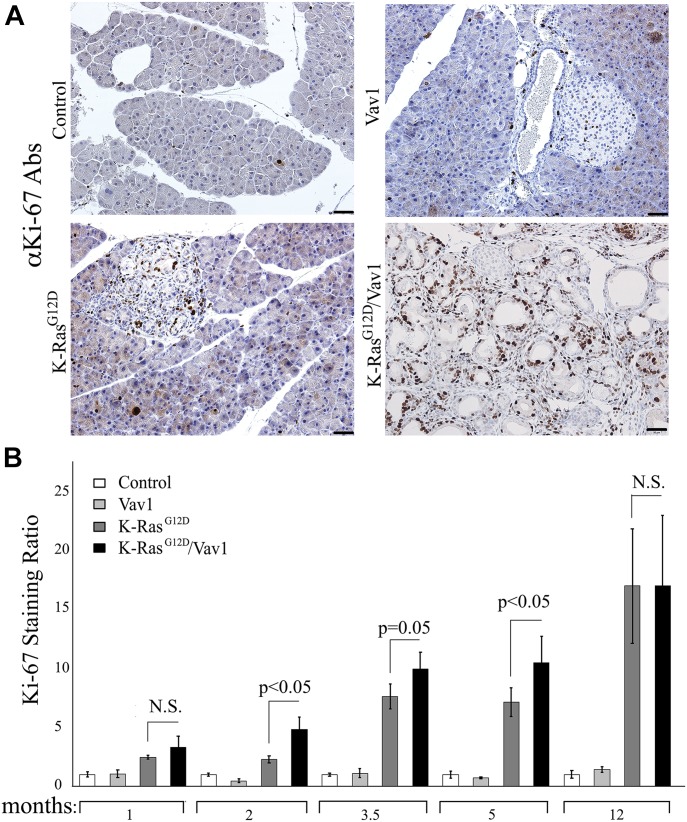
Fig 4. Proliferation of pancreatic cells from control, Vav1, K-RasG12D, and K-RasG12D/Vav1 mice.
Proliferation of acinar and ductal pancreatic cells obtained, at different times after initiation of transgene induction, from control, Vav1, K-RasG12D, and K-RasG12D/Vav1 mice was assessed by anti-Ki-67 staining. (A) Representative pictures of Ki-67–stained pancreatic sections taken from mice 5 mo after the start of transgene induction. Scale bar represents 50 μm. (B) Proliferation was quantified by counting 10 fields from each pancreatic section and calculating the mean value. The numbers of mice used for Ki-67 staining calculations are recorded in Table S1. To obtain the Ki-67 staining ratio in each case, the result at each time point was divided by the result obtained for the control at the same time point. Significant differences between the two analyzed groups (P < 0.05; t test) are indicated. N.S. refers to statistical nonsignificant differences. SEM are shown.

