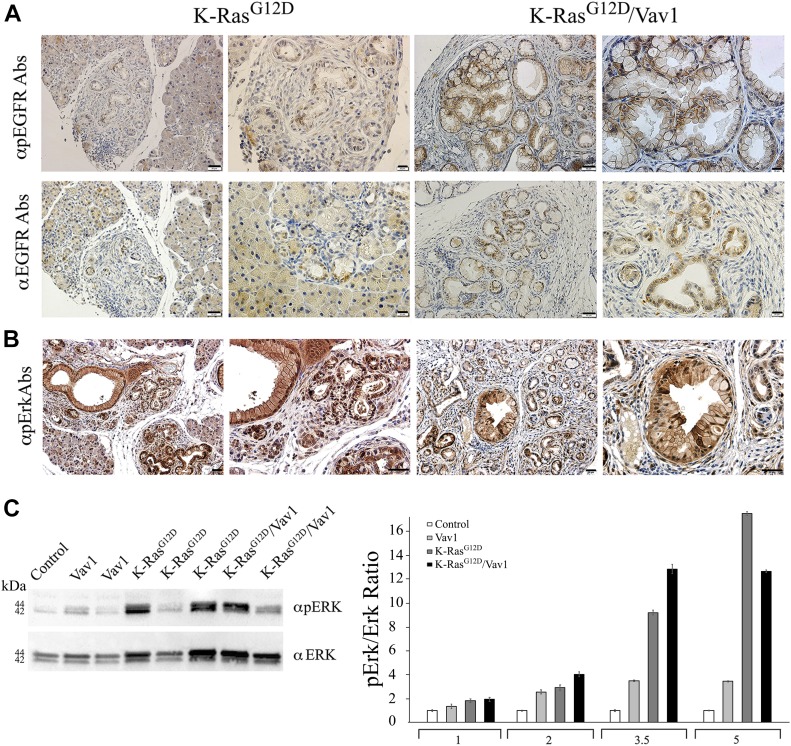
Fig 5. Staining of phospho-EGFR and phospho-Erk in malignant pancreatic lesions from K-RasG12D/Vav1 mice.
(A) Pancreatic sections from 4 K-RasG12D and 8 K-RasG12D/Vav1 mice treated with tamoxifen and Dox for 5 mo were stained for pEGFR (upper panel) and total EGFR (lower panel). Representative pictures at two magnifications are shown. The scale bars represent either 50 μm (left pictures in each group) or 20 μm (right pictures in each group) as indicated. (B) Pancreatic sections from K-RasG12D and K-RasG12D/Vav1 mice treated with tamoxifen and Dox for 5 mo were stained for pERK. Representative pictures are shown. Scale bar represents 20 μm. (C) Lysates from pancreatic tissues of 5-mo post-transgene induction from 3 control, 2 Vav1, 3 K-RasG12D, and 2 K-RasG12D/Vav1 mice were Western blotted using anti–phospho-Erk and anti-Erk (left panel). A representative blot from four independent experiments is shown. Relative Erk phosphorylation in the pancreata of control, Vav1, K-RasG12D, and K-RasG12D/Vav1 mice at 1, 2, 3.5, and 5 mo after the onset of transgene induction was calculated by quantifying their Western blots using ImageJ 1.49V software (right panel). Number of mice in these experiments are outlined in Table S1. SEM are shown.

