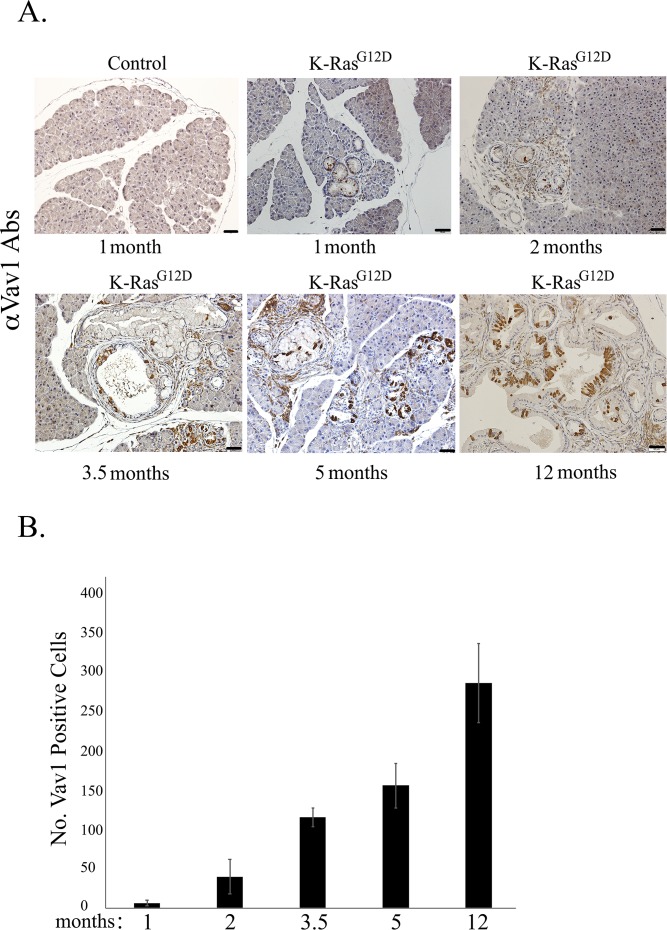
Figure S3. Expression of endogenous Vav1 in the K-RasG12Dmouse pancreas.
(A) Paraffin sections of pancreata from a control mouse (at 1-mo post tamoxifen and Dox administration) and from K-RasG12D mice at the indicated time points after transgene induction were stained with anti-Vav1 antibodies and then assessed for endogenous Vav1 expression. A representative of each of those stained sections is depicted. Scale bar represents 50 μm. (B) Endogenous Vav1 expression was quantified by counting Vav1-positive acinar and ductal cells in K-RasG12D mice at different times after transgene induction: at 1 mo (n = 2), 2 mo (n = 4), 3.5 mo (n = 3), 5 mo (n = 3), and 12 mo (n = 3). Five randomly chosen fields were counted in mouse sections (scale bar represents 50 μm). Calculated mean values of Vav1-positive acinar/ductal cells at each time point are represented in the graph. SEM are shown.

