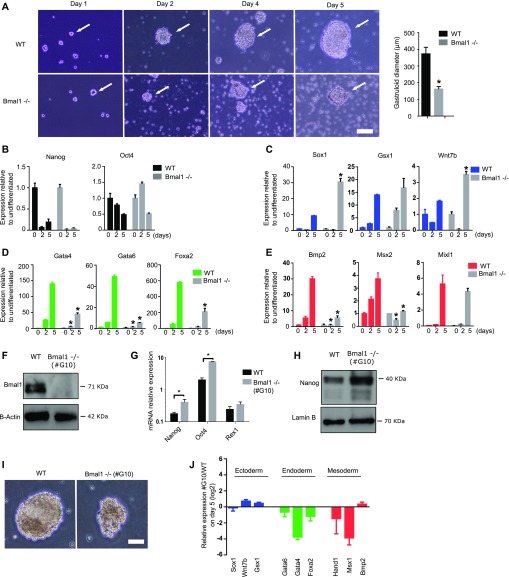
Figure 5. Bmal1−/− mouse embryonic stem cells (mESCs) display altered formation of gastrula-like organoids.
(A) Microscopic images of Bmal1−/− and JM8 wild-type mESCs during differentiation into gastruloids at indicated time points. White arrows indicate the position of the developing gastruloid. Scale bar is 50 μm. Histogram shows the average diameter of wild-type and Bmal1−/− gastruloids on day five. (B, C, D, E) mRNA expression of pluripotency (black)-, ectoderm (blue)-, endoderm (green)-, and mesoderm (red)-specific genes at indicated days during gastruloid formation as measure by RT-qPCR in JM8 wild-type and Bmal1−/− (grey) mESCs. Expression was normalized to Hmbs and Ywhaz. Fold change relative to undifferentiated cells at time cero is represented. (F) Western blot analysis of Bmal1 protein using whole-cell extracts of Bmal1−/− (clone #G10) and wildtype mESCs. B-actin provide a loading control. (G) mRNA expression analysis of pluripotency markers Nanog, Oct4, and Rex1 in Bmal1−/− (clone #G10) and JM8 wild-type mESCs by RT-qPCR. Expression was normalized to Hmbs and Ywhaz. (H) Western blot analysis of Nanog protein using whole-cell extracts of Bmal1−/− (clone #G10) and wild-type mESCs. Lamin B provide a loading control. (I) Microscopic images of gastruloids generated at day five by Bmal1−/− (clone #G10) and JM8 wild-type mESCs. Scale bar is 100 μm. (J) mRNA expression of ectoderm (blue)-, endoderm (green)-, and mesoderm (red)-specific genes on day five of gastruloid differentiation as measured by RT-qPCR in JM8 wild-type and Bmal1−/− (clone #G10) mESCs. Expression was normalized to Hmbs and Ywhaz. Fold change of Bmal1−/− #G10 relative to wild-type is represented. (B, C, D, E, G, J) Mean and SEM of three independent experiments are shown in (B, C, D, E, G, J). Asterisks (*) indicate significant difference (T-student P < 0.05).

