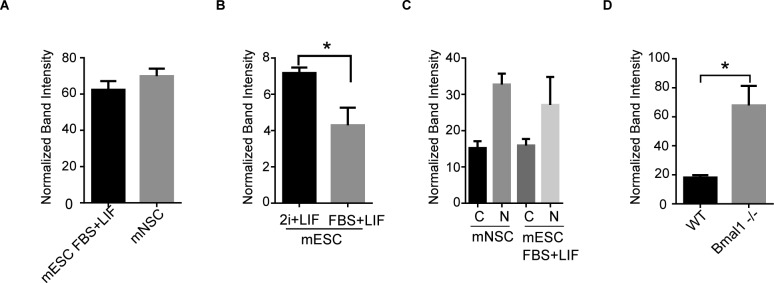
Figure S1. Quantification of Western blot analyses.
(A, B, C, D) Histogram presenting quantification of Western blot analysis as shown in Fig 1E (A), Fig 1G (B), Fig 1J (C), and Fig 2G (D). Mean and SEM of three independent experiments are shown. Asterisks (*) indicate significant difference (T-student P < 0.05).

