
Figure 1.
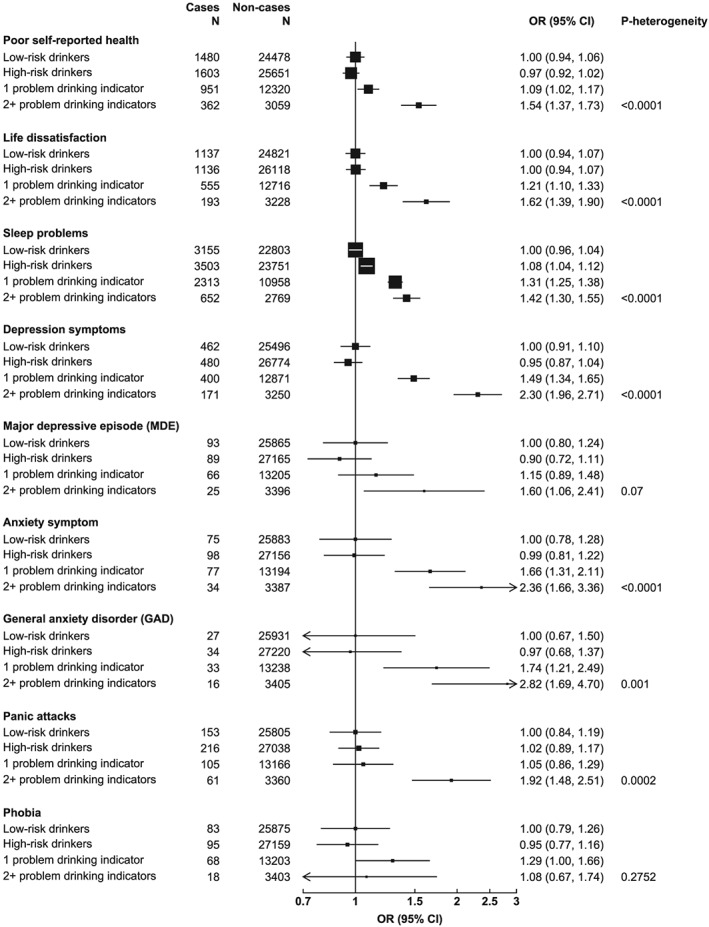
Cross‐sectional associations of problem drinking with wellbeing‐related measures in 69 904 male current regular drinkers. Odds ratios (ORs) were adjusted for age group, region, education, income, marital status, prior chronic diseases, smoking and body mass index (BMI). Each solid square represents an OR; 95% confidence intervals (CIs) are plotted using floating standard errors to allow for comparison between any two categories. The size of each box is inversely proportional to the ‘floated’ variance of the log OR in each group and the error bars indicate the group‐specific 95% CI. HED = heavy episodic drinking. Low‐risk drinkers were current regular drinkers who drank < 200 g/week, with no HED in a typical drinking week or problem drinking indicator reported; high‐risk drinkers were current regular drinkers who either drank at least 200 g/week or engaged in HED in a typical drinking week, but with no problem drinking indicator reported; problem drinkers were current regular drinkers who reported at least one problem drinking indicator, and were further classified into ‘1 problem drinking indicator’ and ‘2+ problem drinking indicators’ according to the number of problem drinking indicators reported.