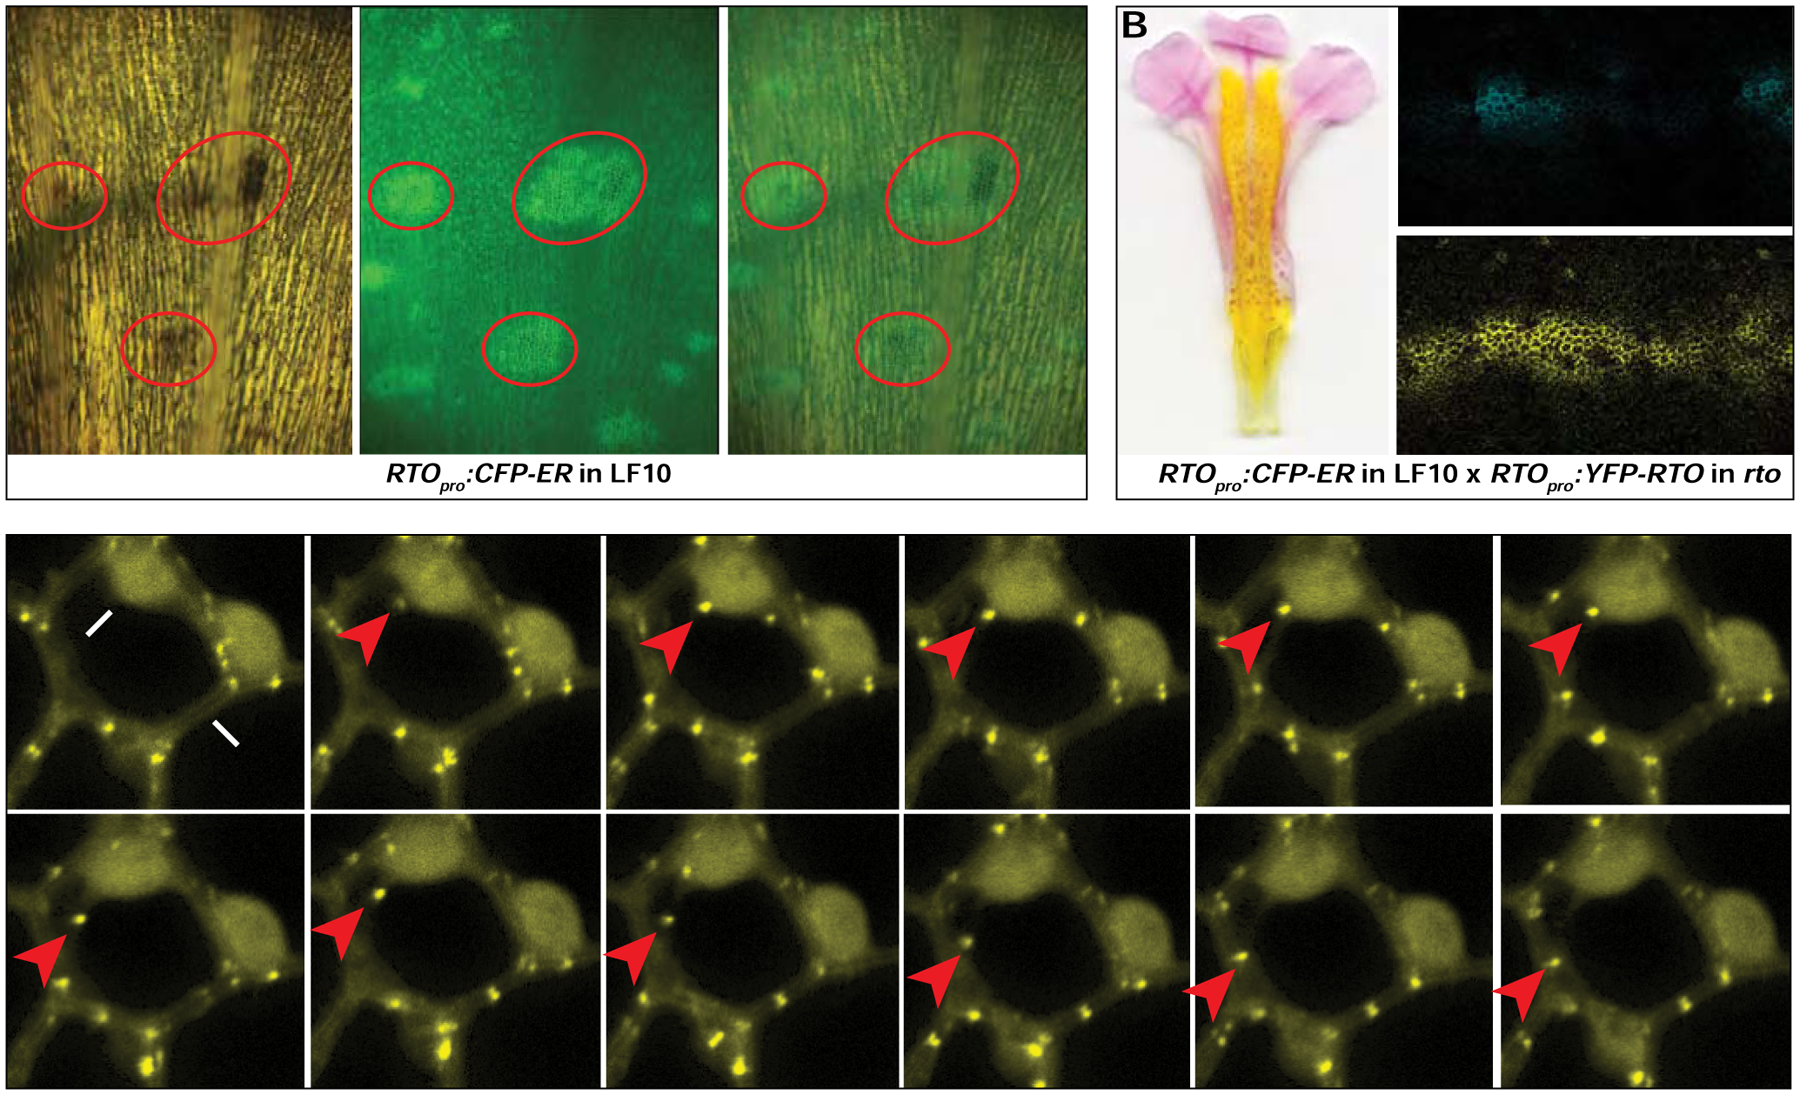
Figure 5. Intercellular movement of RTO in Mimulus lewisii.

(A) Spatial pattern of RTO promoter activity revealed by the RTOpro:CFP-ER construct. The same nectar guide area was imaged under bright light (left) and the green channel (center). The right image is an overlay between the left and the center. The yellow background under bright light is due to carotenoid pigments, and the anthocyanin spots are red. CFP fluorescence signal (i.e., the green spots in the green channel) foreshadows and co-localizes with anthocyanin production (red ovals). (B) F1 hybrids between RTOpro:CFP-ER line 25 (in the wild-type background) and RTOpro:YFP-RTO line 22 (in the rto background) bear flowers similar in anthocyanin phenotype to the non-transgenic RTO/rto heterozygote and reveal a broader spatial distribution of RTO protein (yellow) than RTO promoter activity (blue). (C) A series of still images from a time-lapse video taken every 30 seconds to track the movement of YFP-RTO from nucleus to cytoplasm in 35S:YFP-RTO petal epidermal cells. See also Figure S6, Table S5, and Video S1.
