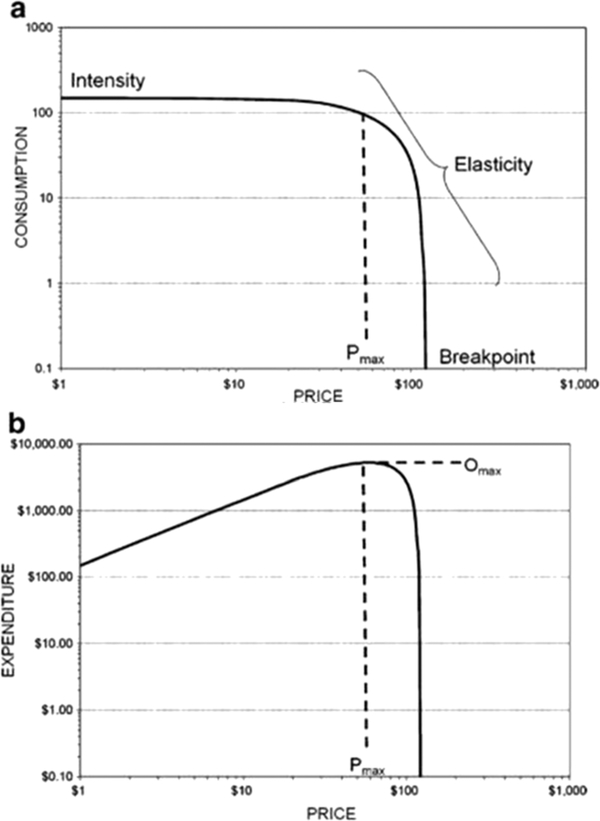
Figure 1.
Conceptual representation of prototypical demand curves elicited by a hypothetical purchase task. Curves are presented in logarithmic units for visual presentation. (a) The demand curve, with average consumption values at each price graphed in logarithmic units. The demand curve captures intensity (consumption when the commodity is free), elasticity (the sensitivity of consumption as a function of increasing price) and breakpoint (the price at which consumption reaches zero). (b) The expenditure curve, with average expenditure (price × consumption) plotted at each price in logarithmic units. The expenditure curve captures Omax (maximum expenditure) and Pmax (the price at which demand becomes elastic). Figures were originally published in MacKillop et al. [6]

