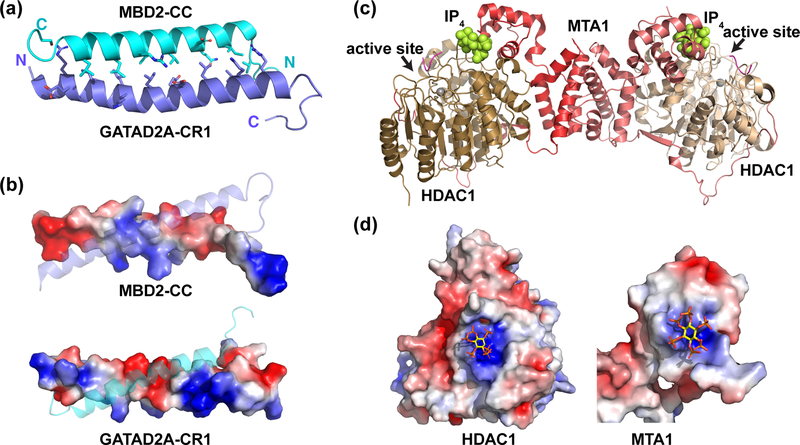
Figure 2. Structural analyses of the MBD2:GATAD2A and MTA1:HDAC1 complexes.
(a) A cartoon diagram depicts the solution structure of the coiled-coil complex between MBD2 (cyan) and GATAD2A (blue) (PBD ID: 2L2L). Amino acids at the protein-protein interface are shown as sticks. (b) A surface rendition of MBD2-CC and GATAD2A colored by electrostatic potential shows alternating patches of positive (blue) and negative (red) regions that promote heterodimerization and minimize homodimerization. (c) A cartoon diagram depicts the crystal structure of the complex between MTA1 (red and light red), HDAC1 (brown and light brown), and a peptide inhibitor (magenta). MTA1 forms a dimer and wraps around HDAC1. An inositol tetraphosphate molecule (space-filled, yellow) binds near the HDAC1 active site. (d) Surface rendering of HDAC1 and MTA1 colored by electrostatic potential shows that IP4 binds to positively charged regions (blue) of each, thereby bridging between surfaces that otherwise would not interact favorably (PDB ID: 5ICN). All structure figures were generated using PyMOL [130] and the electrostatic surface potential using the APBS plugin [131].

