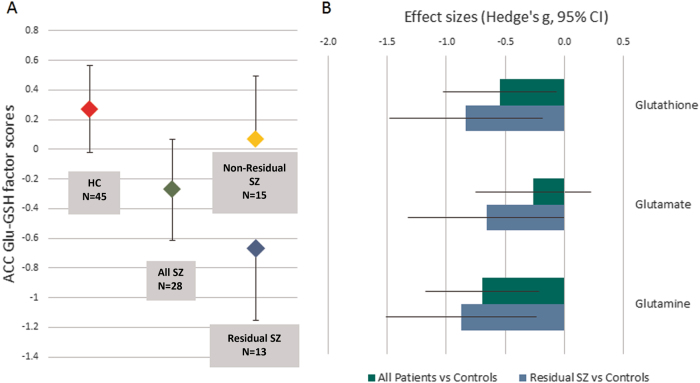
Fig. 3.
Panel a shows mean component scores for the second PCA component loading on glutathione and glutamate concentrations in the ACC. Error bars represent 95% confidence intervals. There were no significant differences in variances between any groups or sub-groups. Panel b shows the effect sizes for differences in mean metabolite concentrations in the ACC between healthy controls and all patients (green bars) and the sub-group of patients with residual schizophrenia (blue bars). Error bars represent 95% confidence limits of the effect size.

