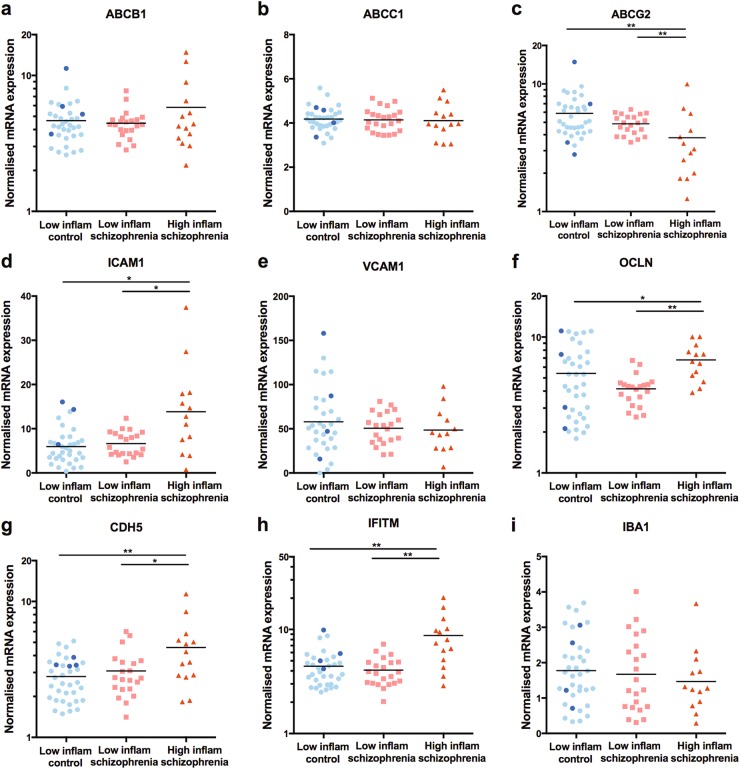
Fig. 2.
mRNA expression measured with qPCR in the DLPFC of (a–h) brain endothelial cell genes and (i) IBA1 grouped according to low inflammation control, low inflammation schizophrenia and high inflammation schizophrenia subgroups based on cortical inflammatory marker expression. Data from high inflammation controls are shown in dark blue for illustrative purposes, but were excluded from statistical analysis due to the small group size. Note that IFITM, ABCG2, ABCB1, CDH5 and OCLN are on log scales. *p < 0.05, **p < 0.01

