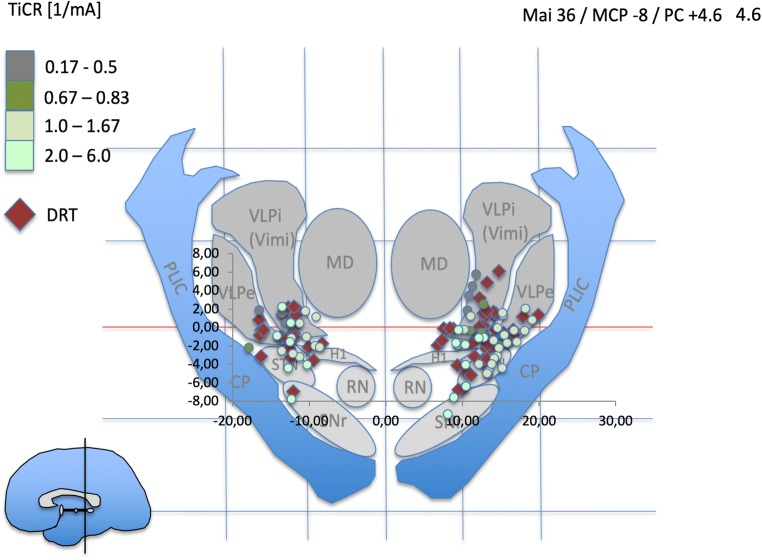
Fig. 3.
Atlas representation of stimulation points (colored dots) and depiction of DRT center (red diamonds) in the mid-commissural point (MCP) system. Normalized data (see Methods section). Idealized atlas slices after Mai et al. (Atlas of the human Brain, 3rd edition, Academic press, 20074). PC + 4.6 is just anterior to the DRT. Light green dots indicate most efficient tremor reduction at minimal current expense as expressed by TiCR. Stimulation coordinates (differentially colored dots) and DRT coordinates are paired. Pairing is not shown for better visualization

