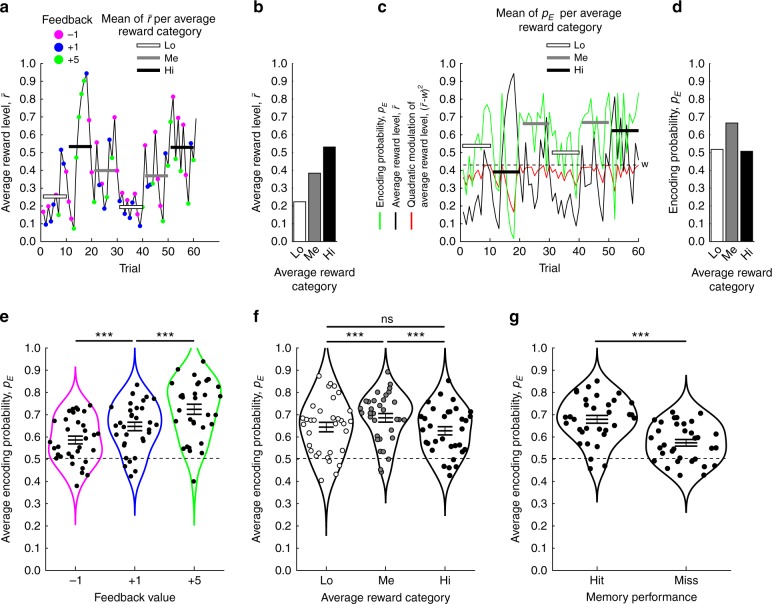
Fig. 2. Computational model.
a–d illustrates how parameter values in the computational model derive from the behavioral data, here for one representative participant. a The average reward level (, black line) tracks preceding feedback values as an exponential running average. The average of ten trials within the different average reward categories (Hi, Me, and Lo) are respectively indicated by white, gray, and black bars. b. The average across average reward categories in (a). c When the encoding probability (pE, green line) is nonlinearly (inverted U-shape) modulated by average reward levels (, black line), pE increases when approaches the optimal level of average reward (w, dashed line). By contrast, pE decreases whenever becomes larger or smaller than w. To further illustrate the nonlinear contribution of to pE, the quadratic term is displayed as a red line. White, gray, and black bars respectively illustrate the average pE of the ten trials within each average reward category. d The average pE across the average reward categories in (c). e Across participants, the most parsimonious model indicates that the encoding probability pE increases monotonically as a function of feedback value, but is nonlinearly modulated by average reward (f). g On average the model predicts higher encoding probabilities for subsequent hits as compared with misses. ***p < 0.001, ns not significant (i.e., p > 0.05), indicates the p value for paired t-test. The horizontal lines in e, f, and g indicate mean ± SEM. Source data are provided as a Source Data file.

