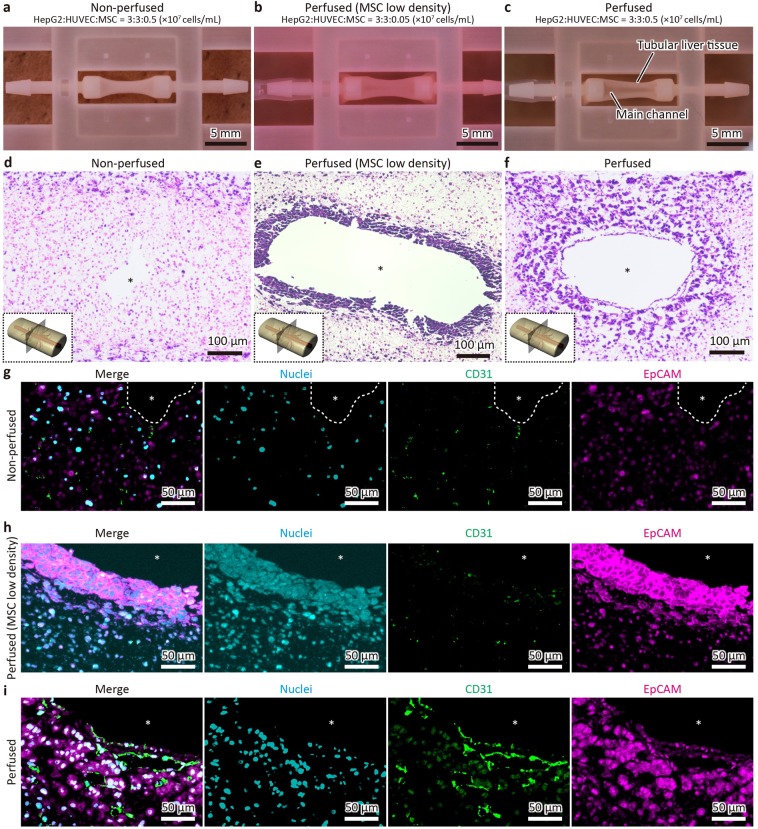
Figure 3.
Histological analysis of perfused liver tissues. (a–c) Appearances of the liver tissues constructed under different conditions as follows: non-perfused condition with a normal density of mesenchymal stem cells (MSCs) (a), perfused condition with a low density of MSCs (b), and perfused condition with the normal density of MSCs (c). HUVECs, human umbilical vein endothelial cells. Asterisks indicate the main channels. (d–f) HE-stained transverse sections of the liver tissues. (g–i) Immunofluorescent images in which cells were stained for nuclei (cyan), CD31 (green), and EpCAM (magenta).

