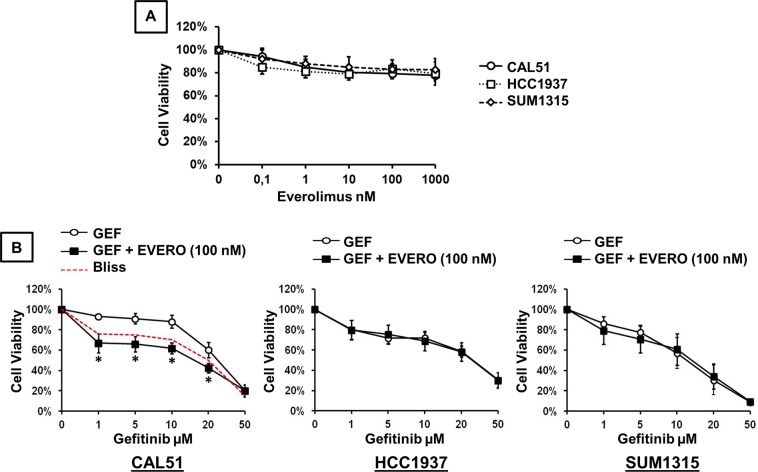
Figure 1.
Cytotoxic effect of gefitinib and everolimus on TNBC cell lines. Cell viability assay was performed using the XTT assay as described in the methods section. (A) Cells were treated for 72 h with increasing concentrations of everolimus. (B) Cells were treated for 72 h with increasing concentrations of gefitinib (GEF) combined with 100 nM everolimus (EVERO). Results are expressed as percent of viability of untreated cell and are mean value ± SD of three independent experiments. The dashed red curve represents the expected Bliss values if the combined effects are additive. *p < 0.0001 for comparison between cells treated with gefitinib as a single agent (1, 5, 10, 20 and 50 μM) and cells treated with gefitinib (1, 5, 10, 20 and 50 μM) combined with 100 nM everolimus.

