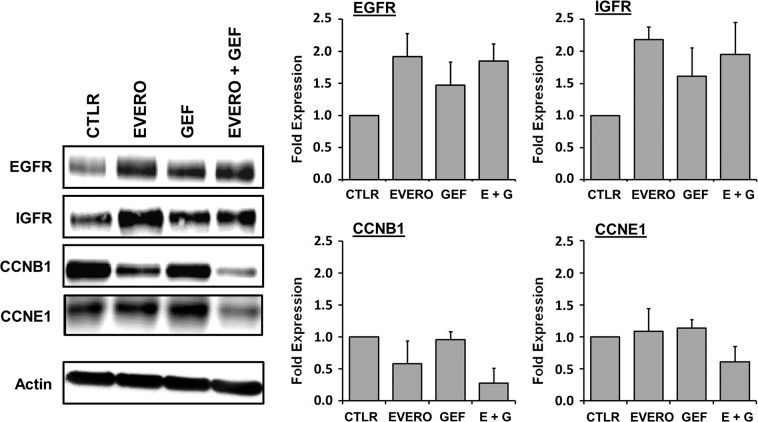
Figure 5.
Western blot analysis of proteins encoded by genes differentially expressed in the CAL-51 cell line after exposure to gefitinib and everolimus. Cells were cultured for 48 h in the presence or absence (CTLR) of 5 µM gefitinib (GEF) and 100 nM everolimus (EVERO). Beta-actin antibody was used as a loading control. Cropped blots from different gels are grouped together for clear illustration. The full-length gels are shown in the Supplementary Information. Bar charts depict densitometric quantification of Western blot signals as described in the materials and methods section. Data shown are representative of two independent experiments.

