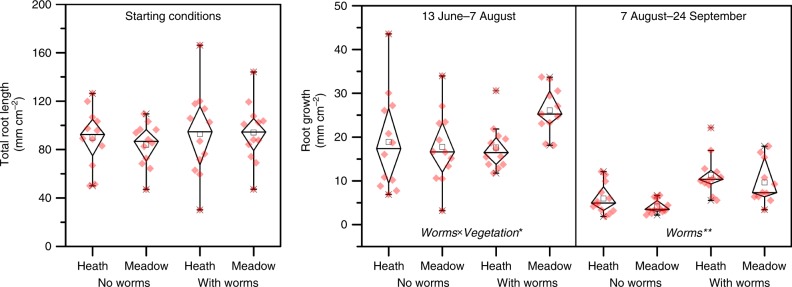
Fig. 5. Belowground plant growth response to earthworm additions.
Boxplot showing the fine root length at the onset of the experiment before the earthworm addition, and the fine root growth after earthworm addition in heath and meadow vegetation (mesocosm with labeled and unlabeled litter are pooled together). Periods when growth was measured are shown at the top. Diamond box indicate the 25%- and 75%-percentile (whiskers indicate the 99% percentile) and black rectangle show the median value. Also shown are all individual measurements (red diamonds). Treatment effects are written at the base of the panels and the level of significance indicated with *(P < 0.05) and **(P < 0.01). Source data are provided as a Source Data file.

