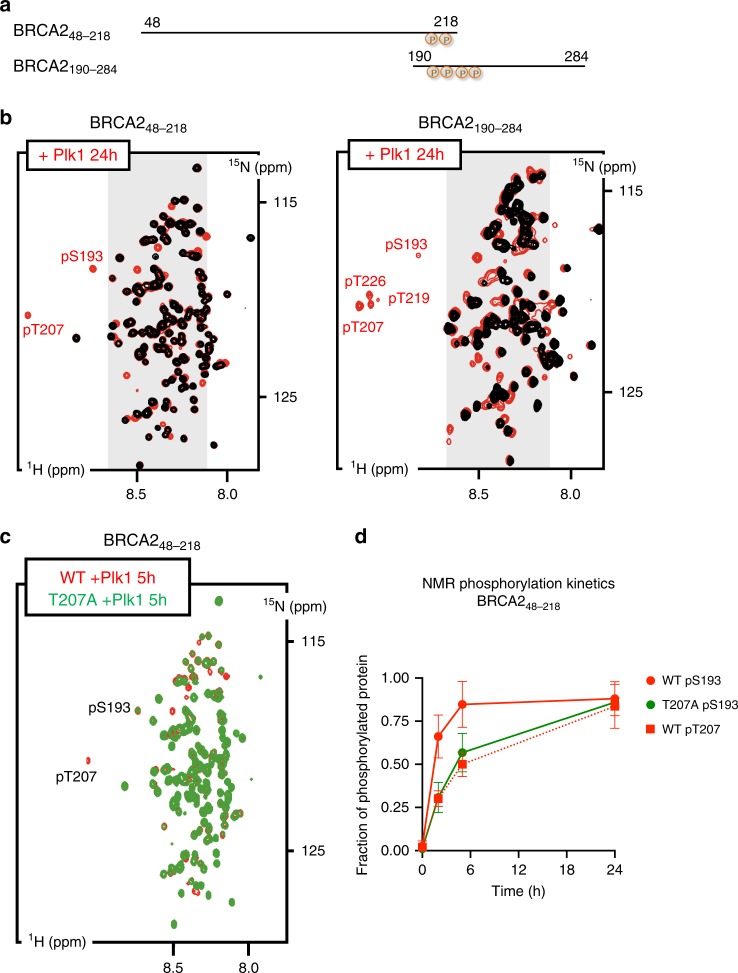
Fig. 2. PLK1 phosphorylates T207 in BRCA248–218 and BRCA2190–284.
Phosphorylation of BRCA248–218 and BRCA2190–284 by PLK1 as observed by NMR. a Schematic view of the two overlapping BRCA2 fragments analyzed by NMR. Residues identified as phosphorylated in (b) are indicated. b Superposition of the 1H-15N HSQC spectra recorded before (black) and after (24 h; red) incubation with PLK1. Each spectrum contains one peak per backbone NH group. Most peaks are located in the gray region of the spectrum, indicating that they correspond to disordered residues. Assignment of each peak to a BRCA2 residue was performed using a classical heteronuclear NMR strategy. Peaks corresponding to phosphorylated residues are indicated. c Comparison of the phosphorylation kinetics recorded for BRCA248–218 WT and T207A. 1H-15N HSQC spectra of BRCA248–218WT (red) and T207A (green) recorded 5 h after addition of PLK1 are superimposed to highlight the overall decrease of phosphorylation observed for the mutant compared to the WT. d Fraction of phosphorylated protein deduced from the intensities of the peaks corresponding to the non-phosphorylated and phosphorylated residues plotted as a function of time. WT S193 and T207 timepoints are represented by red circles and squares, respectively, while T207A S193 timepoints are represented by green circles. The graph represents data as mean ± SD from three independent experiments. Source data are available as a Source Data file.

