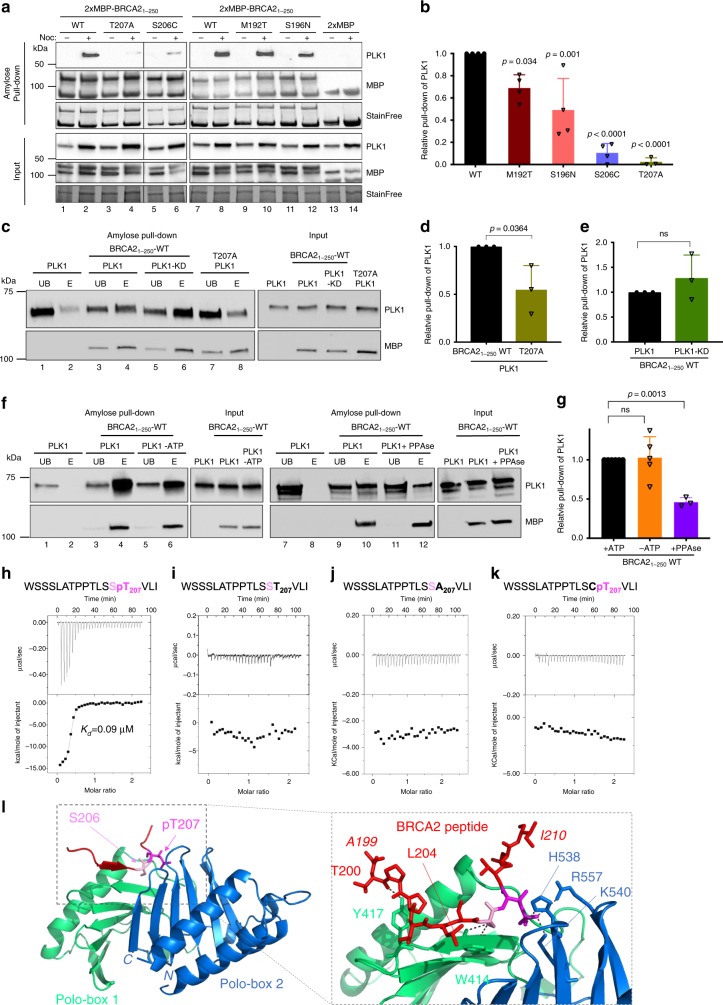
Fig. 3. BRCA2 variants showing reduced phosphorylation by PLK1 impair PLK1 binding.
a Amylose pull-down of U2OS transiently expressing 2xMBP-BRCA21-250 (WT), the variants (M192T, S196N, S206C, and T207A) or the 2XMBP-tag treated with nocodazole as indicated. 4–15% SDS-PAGE followed by WB using anti-PLK1 and anti-MBP antibodies. StainFree images are used as loading control (cropped image is shown). b Quantification of co-immunoprecipitated PLK1 with WT in (a), relative to the input levels of PLK1. Results are presented as the fold change compared to WT. The data represent the mean ± SD of three to four independent experiments (WT (n = 4), M192T (n = 4), S196N (n = 4), S206C (n = 4), T207A (n = 3)). One-way ANOVA test with Dunnett’s multiple comparisons test was used to calculate statistical significance of differences (p-values compared to WT). c PLK1 (or PLK1-KD) as indicated in vitro kinase assay followed by amylose pull-down of BRCA21-250-WT or T207A. 10% SDS-PAGE followed by WB using anti-PLK1 and anti-MBP antibodies. d, e Quantification of the PLK1 pull-down in (c) relative to the PLK1 levels in the input. Results are presented as the fold change compared to BRCA21-250-WT in (d) and PLK1-WT in (e). The data represent the mean ± SD of three independent experiments, two-tailed unpaired t-test was used to calculate significance of differences (ns (non-significant)). f PLK1 in vitro kinase assay followed by amylose pull-down assay as in (c) Left panel: with or without ATP as indicated. Right panel: The 2×-MBP-BRCA21-250-WT polypeptide was pre-treated with phosphatase (FastAP) for 1 h before the amylose pull-down (c). In (c) and (f): UB: unbound, E: eluted. g Quantification of the PLK1 pull-down in (f) relative to the PLK1 levels in the input. Results are presented as the fold change compared to kinase assay performed with non-phosphatase treated BRCA21–250-WT in the presence of ATP. The data represent the mean ± SD of three to five independent experiments (+ATP (n = 5), −ATP (n = 5), +PPAse (n = 3)), one-way ANOVA test with Dunnett’s multiple comparisons test was used to calculate statistical significance of differences (p-values compared to +ATP; ns (non-significant)). h–k Isothermal Titration Calorimetry (ITC) thermograms showing binding of PLK1PBD to a 17 aa BRCA2 peptide containing (h) pT207, (i) T207, (j) A207, (k) C206pT207. Residues S206 and pT207 are highlighted in pink (S206) and magenta (pT207) in the peptide sequences. l Left panel: 3D cartoon representation of the crystal structure of PLK1PBD (Polo-box 1 in green and Polo-box 2 in blue) bound to the BRCA2 peptide containing pT207 (in red except for S206 (pink, sticks) and pT207 (magenta, sticks)). Right panel: zoom in on the interface between PLK1PBD and the BRCA2 peptide (from A199 to I210). The amino acids of PLK1PBD and BRCA2 involved in the interaction are highlighted in sticks representation with hydrogen bonds depicted as dark gray dots. Source data are available as a Source Data file.

