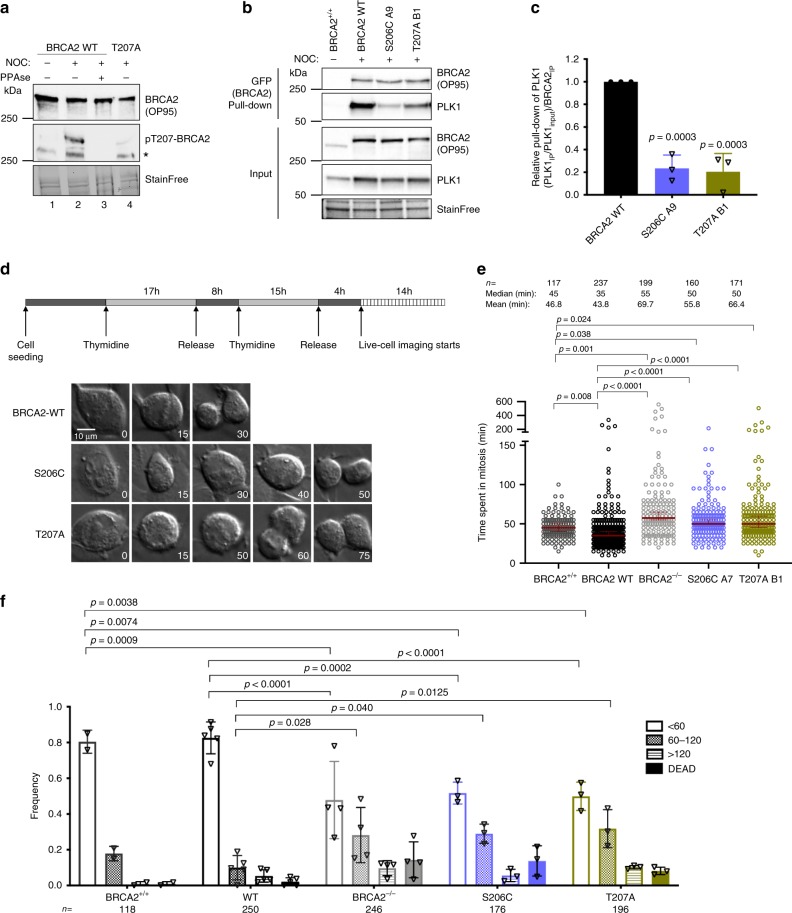
Fig. 4. Cells bearing BRCA2 variants S206C and T207A prolong mitosis.
a Protein levels of BRCA2 and pT207-BRCA2 in cells bearing BRCA2 WT or the T207A variant from whole cell lysates of nocodazole-arrested (100 ng/µl for 14 h) or asynchronous cells. 4–15% SDS-PAGE followed by WB using anti-BRCA2. The same blot was stripped and re-probed with anti-pT207-BRCA2 antibody. Lane 3 protein extracts were pre-treated with phosphatase (FastAP) for 1 h before loading onto the gel. Asterisk indicates a non-specific band. (b) GFP-trap pull-down of EGFPMBP-BRCA2 from cells bearing BRCA2 WT, S206C or T207A. 4–15% SDS-PAGE followed by WB using anti-BRCA2 and -PLK1 antibodies. Asynchronous DLD1 cells with endogenous BRCA2 (BRCA2+/+) were used as control for the pull-down and StainFree images of the gels before transfer as loading control (cropped image is shown). c Quantification of co-immunoprecipitated PLK1 with EGFP-MBP-BRCA2 in (b) relative to the PLK1 protein levels in the input and the amount of pull-down EGFP-MBP-BRCA2 ((PLK1IP /PLK1input)/EGFP-MBP-BRCA2IP) Results are presented as the fold change compared to the BRCA2 WT clone. The data represent the mean ± SD of three independent experiments. One-way ANOVA test with Dunnett’s multiple comparisons test was used to calculate statistical significance of differences (p-values compared to WT). d Top: Synchronization scheme. Bottom: Representative still images of the time-lapse videos. Numbers represent time (min) after nuclear envelope break down (NEBD). Scale bar represents 10 µm. e Quantification of the time the cells spent in mitosis in (d). The red line indicates the median (95% CI). Each dot represents a single cell, n is the total number of cells from two to four independent experiments (45–60 cells per experiment) (BRCA2+/+ (n = 2), WT C1 (n = 5), BRCA2−/− (n = 4), S206C A7 (n = 3), T207A B1 (n = 3)). Kruskal–Wallis one-way analysis followed by Dunn’s multiple comparison test was used to calculate statistical significance of differences. f Frequency distribution of the time spent in mitosis in (d), including cells that fail to divide (DEAD). The error bars represent mean ± SD of two to four independent experiments (BRCA2+/+ (n = 2), WT C1 (n = 5), BRCA2−/− (n = 4), S206C A7 (n = 3), T207A B1 (n = 3)). Two-way ANOVA test with Tukey’s multiple comparisons test was used to calculate statistical significance of differences. Source data are available as a Source Data file.

