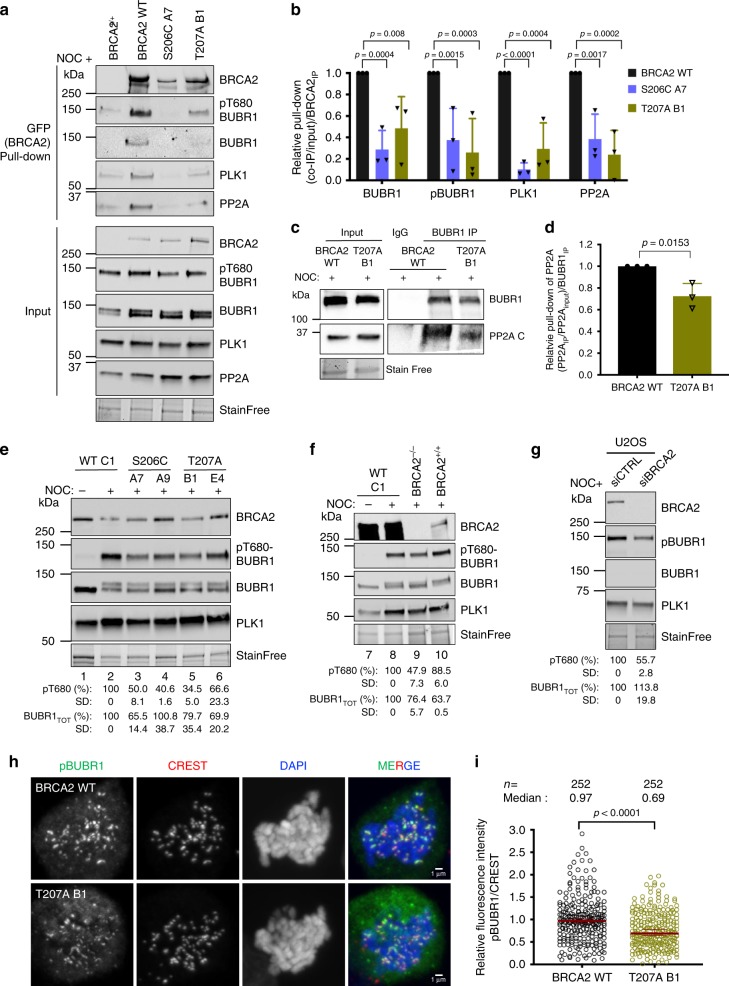
Fig. 5. S206C and T207A impair the complex of BRCA2 with PLK1-BUBR1-PP2A and reduce the levels of pBUBR1 at the kinetochore.
a Pull-down of BRCA2 using GFP-trap beads from mitotic cell extracts of cells bearing BRCA2 WT cells or the variant S206C and T207A. Complexes containing BRCA2-BUBR1/pBUBR1-PP2A-PLK1 were detected by 4–15% SDS-PAGE followed by WB using anti-BRCA2, -BUBR1, -pT680-BUBR1, -PLK1 and -PP2AC (PP2A catalytic subunit) antibodies. Mitotic BRCA2+/+ cells were used as control pull-down. b Quantification of co-immunoprecipitated BUBR1, pBUBR1, PLK1 and PP2A with EGFPMBP-BRCA2 in (a), relative to the input levels of each protein and the amount of pull-down EGFP-MBP-BRCA2. Results are presented as the fold change compared to the BRCA2 WT clone. The data represent the mean ± SD of three independent experiments. Two-way ANOVA test with Dunnett’s multiple comparisons test was used to calculate statistical significance of differences. c IP of endogenous BUBR1 from mitotic cell extracts of BRCA2 WT cells or BRCA2-T207A using mouse anti-BUBR1 antibody. Mouse IgG was used as control. 4–15% SDS-PAGE followed by WB using rabbit anti-BUBR1 and anti-mouse PP2AC antibodies. d Quantification of co-IPed PP2A in (c), relative to the input levels and the amount of IPed BUBR1. Results are presented as the fold change compared to the BRCA2 WT clone. The data represent the mean ± SD of three independent experiments. Unpaired two-tailed t-test was used to calculate statistical significance of differences. e–g WB showing the protein levels of endogenous BUBR1 and pT680-BUBR1 in nocodazole treated cells bearing BRCA2 WT or the variants, as indicated (e) BRCA2−/− or BRCA2+/+ (f). g WB showing the protein levels of endogenous BUBR1 and pT680-BUBR1 in U2OS after depletion of endogenous BRCA2 by siRNA. e–g The mean BUBR1TOT and pBUBR1 signal relative to the stain free signal is shown for the nocadozole treated samples below the blots, results are presented as percentage compared to BRCA2 WT clone. The data represent the mean ± SD of three (e) and two (f and g) independent experiments. The protein levels of PLK1 in (a, e–g) are shown as a G2/M marker. h Representative images of the localization of pT680-BUBR1 in cells bearing BRCA2 WT or the variant T207A as indicated. CREST is used as centromere marker and DNA is counterstained with DAPI. Scale bar represents 1 µm. i Quantification of the co-localization of pT680-BUBR1 and CREST in (h). The data represent the intensity ratio (pT680-BUBR1:CREST) relative to the mean ratio of pT680-BUBR1:CREST for the GFP-MBP-BRCA2 WT calculated from two independent experiments (252 pairs of chromosomes analyzed). The red line in the plot indicates the median (95% CI) ratio, each dot represents a pair of chromosomes. Mann–Whitney two-tailed analysis was used to calculate statistical significance of differences. Source data are available as a Source Data file.

