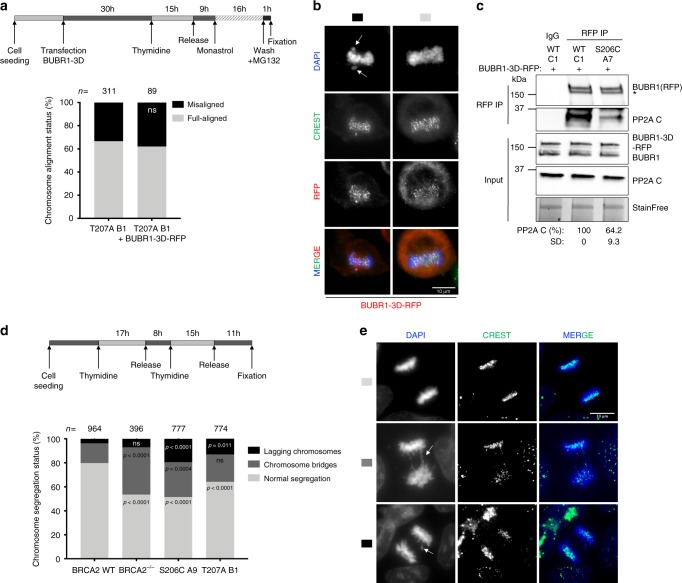
Fig. 7. Cells expressing BRCA2 variants S206C and T207A display aberrant chromosome segregation.
a Top: Scheme of the synchronization procedure. Bottom: Quantification of misaligned chromosomes in BRCA2-T207A stable clones transiently overexpressing the 3xFLAG-BUBR1-3D-RFP mutant (S670D, S676D and T680D). n indicates the total number of cells counted from two independent experiments. Unpaired two-tailed t-test was used to calculate statistical significance of differences, ns (non-significant)). b Representative images of the type of chromosome alignment observed in cells overexpressing 3xFLAG-BUBR1-3D-RFP quantified in (a); scale bar represents 10 µm. c Co-immunoprecipitation of endogenous PP2A with transiently overexpressed 3xFLAG-BUBR1-3D-RFP mutant from mitotic cell extracts of BRCA2 WT cells or cells bearing the S206C variant using rabbit anti-RFP antibody. Rabbit IgG was used as control for the BUBR1 immunoprecipitation. The immunocomplexes were resolved on 4–15% SDS-PAGE followed by WB using mouse anti-BUBR1 and PP2AC antibodies. The amount of PP2A co-immunoprecipitated with BUBR1-3D-RFP relative to the input levels of PP2A and the amount of immunoprecipitated BUBR1-3D-RFP is presented below the blot as mean ± SD from two independent experiments. The data are presented relative to the non-treated BRCA2 WT. Asterisk denotes a non-specific band (d). Top: Scheme of the synchronization procedure. Bottom: Quantification of cells with aberrant chromosomes segregation in BRCA2−/− cells and in the clones stably expressing BRCA2 WT, S206C and T207A, as indicated. Two-way ANOVA test with Tukey’s multiple comparisons test was used to calculate statistical significance of differences (the p-values show the significant differences compared to WT; ns (non-significant)). n in (d) indicates the total number of cells counted for each clone from two (BRCA2−/−, S206C and T207A) and five (BRCA2 WT) independent experiments. e Representative images of the type of aberrant chromosome segregation observed in the cells quantified in (d), CREST antibody is used as marker of centromere; nuclei are revealed with DAPI counterstaining. Scale bar represents 10 µm. Source data are available as a Source Data file.

