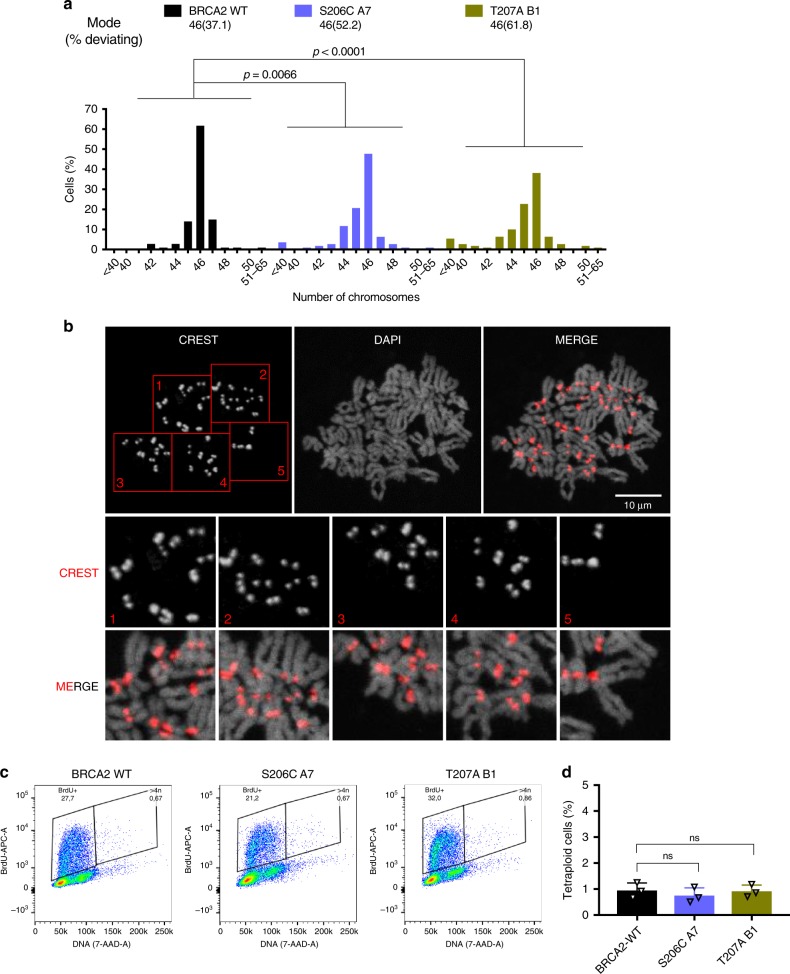
Fig. 8. Cells expressing BRCA2 variants S206C and T207A exhibit aneuploidy.
a Distribution of the number of chromosomes observed in metaphase spreads of stable clones expressing BRCA2 WT, S206C A7 or T207 B1, total number of cells counted; BRCA2 WT (n = 105), S206C A7 (n = 111) and T207A B1 (n = 110) from two independent experiments. Modal number of chromosomes and percentage deviating from the mode are shown at the top. Kruskal-Wallis one-way analysis followed by Dunn’s multiple comparison test was used to calculate statistical significance of differences. The cell passage was between 5 and 9 (BRCA2 WT (p.6 and p.9), S206C A7 (p.5 and p.9) and T207A B1 (p.6 and p.9). b Representative image of two independent experiments of metaphase spreads of the DLD1 BRCA2 deficient stable cells bearing the S206C BRCA2 variant stained with CREST and counterstained with DAPI. In this example, the cell contains 45 chromosomes. c–d Analysis of S-phase tetraploid cells in cells bearing BRCA2 WT or the VUS S206C and T207A measured by flow cytometry after 20 min of BrdU incorporation. c Representative flow cytometry plots of cells stained with anti-BrdU-APC antibodies and 7-AAD (DNA). d Frequency of S-phase tetraploid cells in stable clones expressing BRCA2 WT or the VUS S206C and T207A. The data represents the mean ± SD of three independent experiments (cell passage: 6–10). One-way ANOVA test with Tukey’s multiple comparisons test was used to calculate statistical significance of differences (the p-values show the difference compared to WT, ns: non-significant). Source data are available as a Source Data file.

