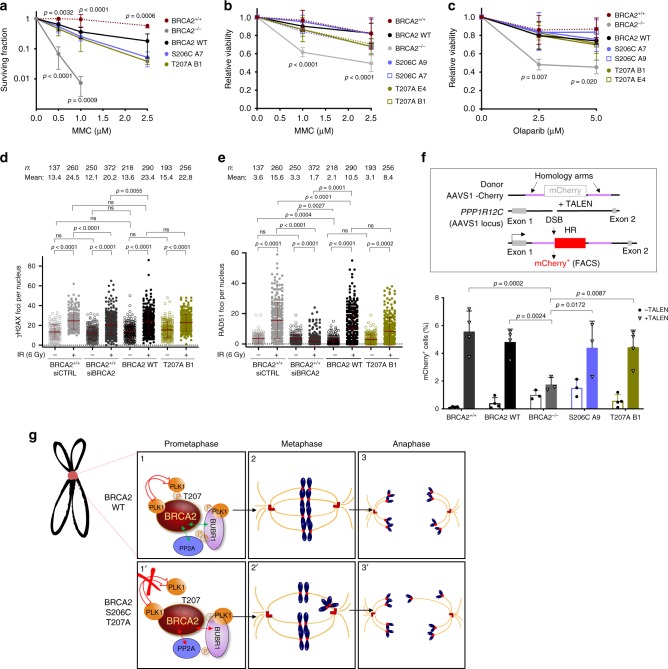
Fig. 9. The DNA repair proficiency is not affected in cells bearing BRCA2 variants S206C and T207A.
a Quantification of the surviving fraction of BRCA2+/+ or stable clones expressing BRCA2 WT or the variants S206C or T207A assessed by clonogenic survival upon exposure to MMC at concentrations: 0, 0.5, 1.0, and 2.5 µM. Data are represented as mean ± SD: BRCA2+/+ (red) (n = 3), BRCA2−/− (gray) (n = 6), WT C1 (black) (n = 6), S206C A7 (blue) (n = 3), T207A B1 (green) (n = 4). b–c Quantification of the relative cell viability monitored by MTT assay upon treatment with increasing doses of MMC (b) or the PARP inhibitor Olaparib (c), as indicated. The data represent the mean ± SD of four (b) and three (c) independent experiments. a–c Two-way ANOVA test with Tukey’s multiple comparisons test was used to calculate statistical significance of differences (the p-values show the significant differences compared to the BRCA2 WT clone). d–e Quantification of the number of γH2AX foci (d) or RAD51 foci per nucleus (e) 2 h after 6 Gy of γ-irradiation (+IR) versus non-irradiated conditions (−IR), in DLD1 BRCA2+/+ cells depleted of BRCA2 (siBRCA2) or control cells (siCTRL) or cells bearing BRCA2 WT or the variant T207A. n indicates the total number of cells counted from two independent experiments. Kruskal-Wallis one-way analysis followed by Dunn’s multiple comparison test was used to calculate statistical significance of differences. The red line in the plot indicates the mean ± SD, each dot represents a single focus. f Top: Scheme of the DSB-mediated gene targeting HR assay. Bottom: Frequency of mCherry positive cells in cells transfected with the promoter-less donor plasmid (AAVS1-2A-mCherry) without (−TALEN) or with (+TALEN) nucleases. The error bars represent mean ± SD of three to four independent experiments (BRCA2+/+ (n = 4), WT (n = 4), BRCA2−/− (n = 3), S206C A9 (n = 3), T207A B1 (n = 4)). Two-way ANOVA test with Tukey’s multiple comparisons test. g Model for the role of PLK1 phosphorylation of BRCA2 T207A by PLK1 in mitosis (see text for details). In panel 1 and 1′ the two-sided arrows represent a complex between the two proteins as indicated either favored by BRCA2 WT (green) or impaired in the BRCA2 mutated form (red); in panels 2, 2′, 3 and 3′ blue blobs represent chromosomes, red circles represent the kinetochores, red cylinders represent the centrioles and orange lanes represent the spindle microtubules. Source data are available as a Source Data file.

