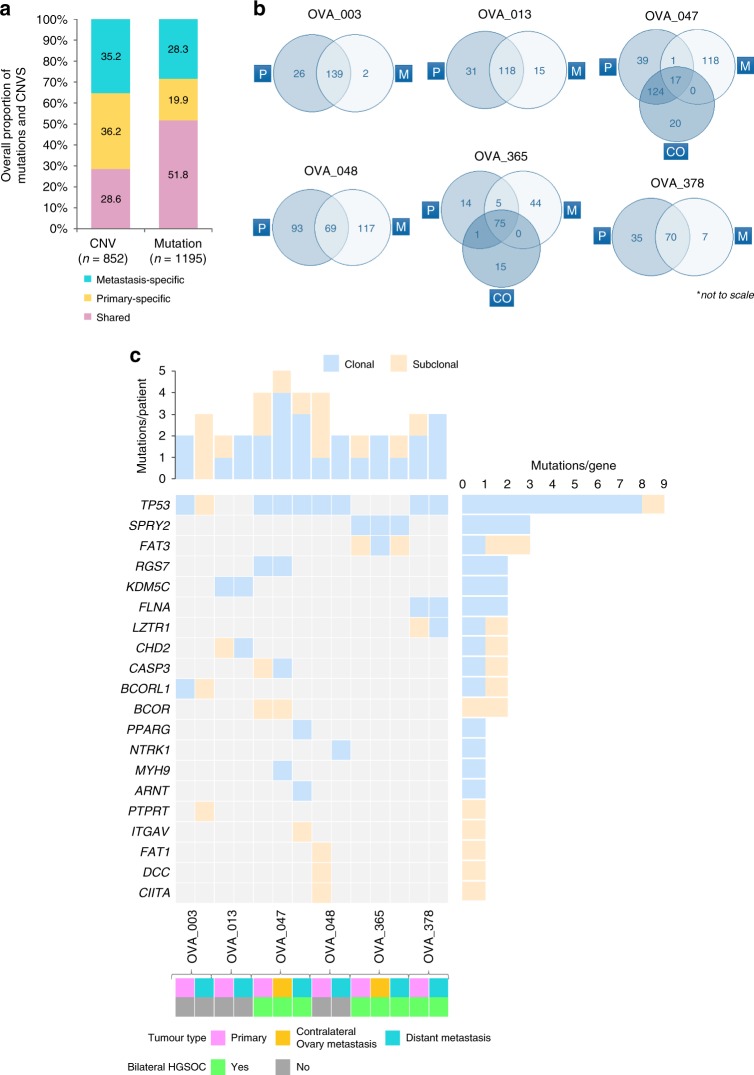
Fig. 1. Distribution of alterations through HGSOC metastatic tumour progression.
a Overall percentage of CNVs (n = 852) and mutations (n = 1195) shared between the primary and metastasis, specific to the primary and specific to the metastasis. b Venn diagrams show the number of unique and shared mutations in primary and metastatic tumours in each case; ‘P’ represents primary tumour, ‘CO’ represents the contralateral ovarian metastatic tumour and ‘M’ represents metastatic tumour. Venn diagrams are not to scale. c All cancer driver mutations (SNVs and Indels) detected for each HGSOC primary and corresponding metastasis, including contralateral ovary metastasis, where relevant. The top panel displays the number of driver mutations/patient identified across tumours, whereas the right panel shows the total count of driver mutations/gene.

