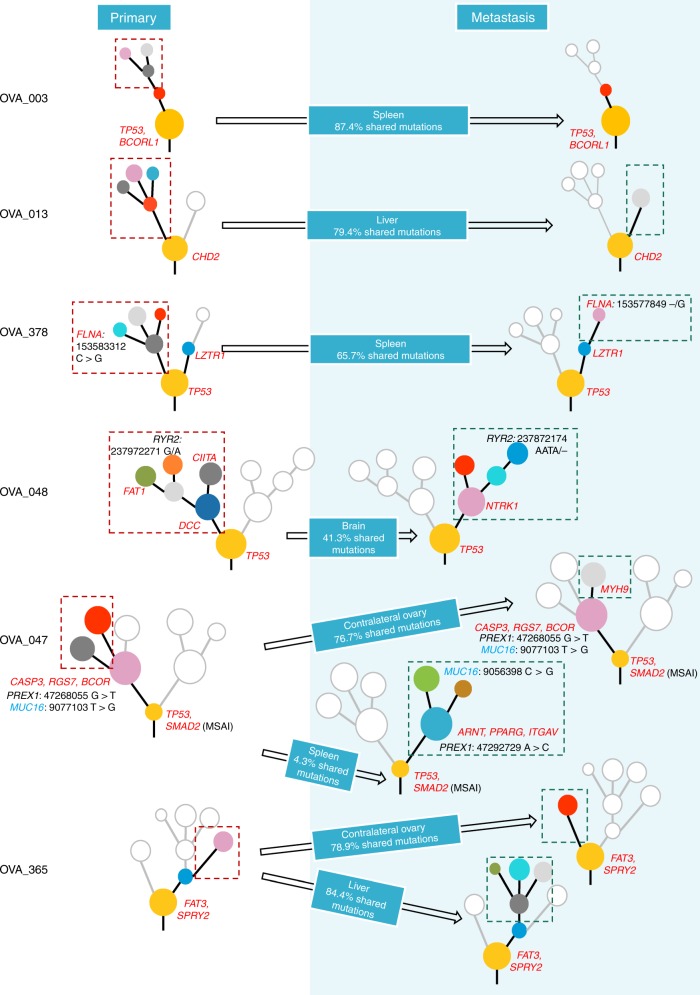
Fig. 3. Phylogenetic tree summary.
Phylogenetic trees for six HGSOC tumours from primary to metastasis. Highlighted are driver genes (in red), and parallel events converging at cancer genes (in blue) and non-cancer genes (in black). Different coloured nodes represent distinct clones. Arrows indicate unidirectional metastatic progression after X% shared mutations at primary tumour to stated regional and distant sites. Clones specific to primary tumour tissues, ablated by therapy, not selected during metastatic seeding or occurred after metastatic seeding, have been outlined with red dashed lines. New clones in metastatic tumour tissues have been outlined with dark green dashed lines.

