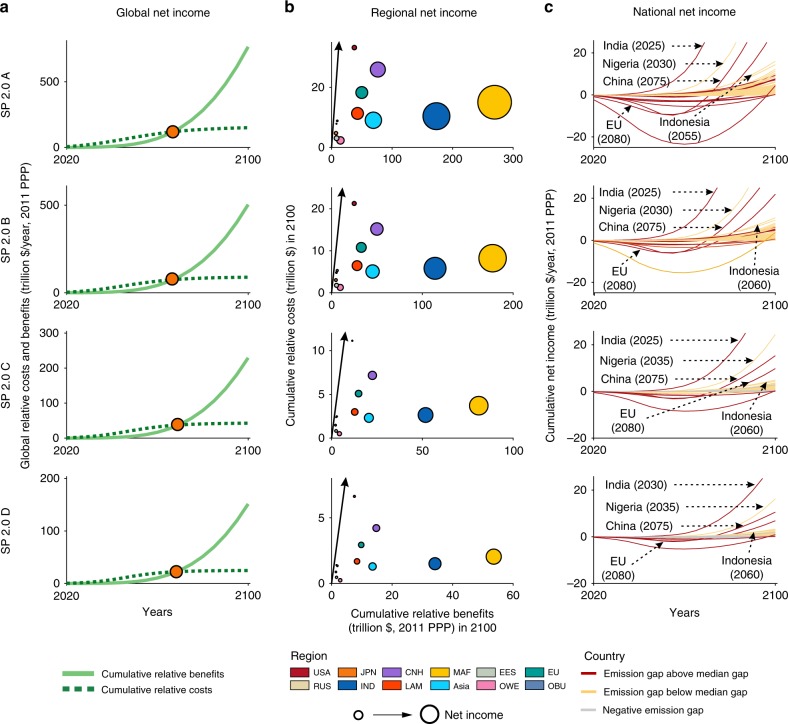
Fig. 2. Net income between policy-as-usual scenario following the current reduction efforts and SP 2.0 s at the global, regional, and national levels.
a Global cumulative relative costs and benefits under 2 °C target. The circles indicate the turning point where the benefits exceed the costs. The cumulative relative benefits (light green line) mean the avoided cost of climate impact. Cumulative relative costs (dark green dotted line) mean the cost of climate mitigation. b Regional cumulative relative benefits and costs in 2100 under 2 °C target. The black line indicates that the benefits and costs are equal. Countries or regions on the right side of the black line have positive net income. The size of the bubble refers to regions’ cumulative net income in 2100. Different colors represent different regions. USA the United States, CHN China, JPN Japan, IND India, EU the European Union, Asia Asia excluding China, India, and Japan, RUS Russia Federation, MAF the Middle East and Africa, EES Eastern European and Commonwealth of Independent States countries (except the Russian Federation), LAM Latin America, OBU other branches of umbrella group, i.e., Canada, Australia, and New Zealand, OWE other developed countries in Western Europe. c National net income from 2020 to 2100 under 2 °C target. Unit, trillion dollars per year. The emission gap in c means the difference in the GHG emissions between current NDCs and self-preservation scenarios. The positive emissions gap indicates the further required GHG emissions reduction. Numbers in parentheses refer to year of break-even points.

