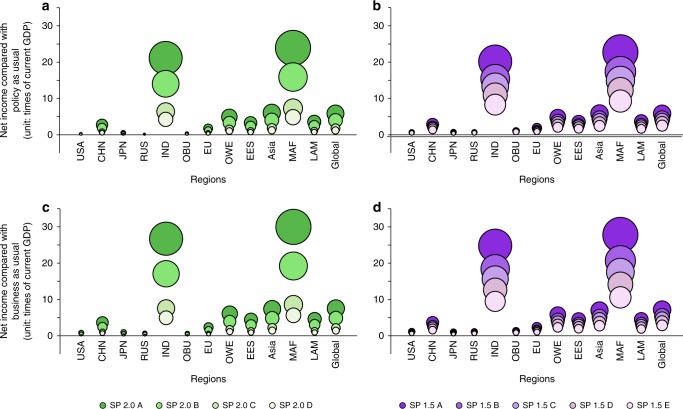
Fig. 5. Net income of self-preservation strategies at the regional levels (unit: times of the regional or national GDP in 2015).
a Net income following the current reduction efforts (policy-as-usual scenario) of 2 °C. b Net income following the current reduction efforts (policy-as-usual scenario) of 1.5 °C. c Net income following the business-as-usual (BaU) efforts of 2 °C. d Net income following the BaU efforts of 1.5 °C. The size of the bubble refers to the times of net income compared with regional GDP in 2015. Colors from dark to light green and purple represent SP 2.0 scenarios from A to D and SP 1.5 scenarios from A to E, respectively.

