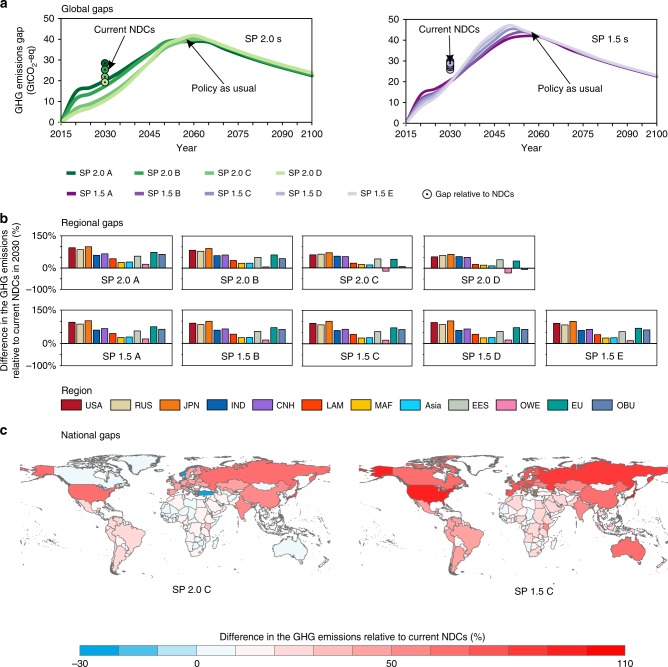
Fig. 6. GHG emission gaps at the global, regional, and national levels.
a Emissions gaps at the global level. The lines stand for emissions gaps between policy-as-usual scenario following the current reduction efforts and self-preservation scenarios, and the points stand for emissions gaps between the current NDCs and self-preservation scenarios. Colors from dark to light green and purple represent SP 2.0 scenarios from A to D and SP 1.5 scenarios from A to E, respectively. b Emissions gaps between current NDCs and self-preservation scenarios at the regional level in 2030. c Emissions gaps between current NDCs and self-preservation scenarios at the country level in 2030. The positive emissions gap indicates the further required GHG emissions reduction.

