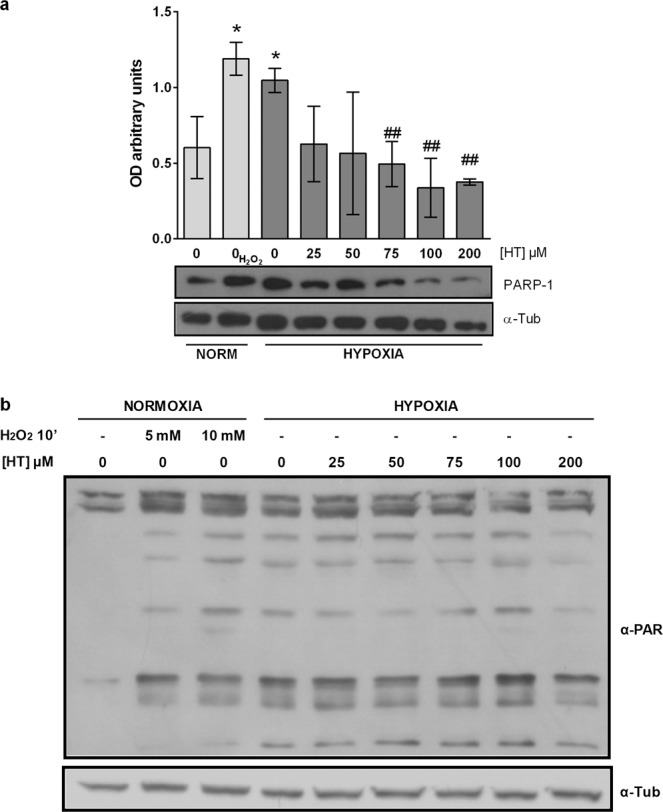
Figure 2.

HT decreases PARP-1 protein level and activity. (a) Densitometric quantifications of PARP-1, protein level relative to α-tubulin (α-Tub). A representative immunoblot is shown. Values represent the mean ± SD from three independent experiments. Statistically significant differences with the corresponding non-treated normoxic cells: *p < 0.05. Statistically significant differences with the corresponding non-treated hypoxic cells: ##p < 0.01. (b) α-PAR representative immunoblot.
