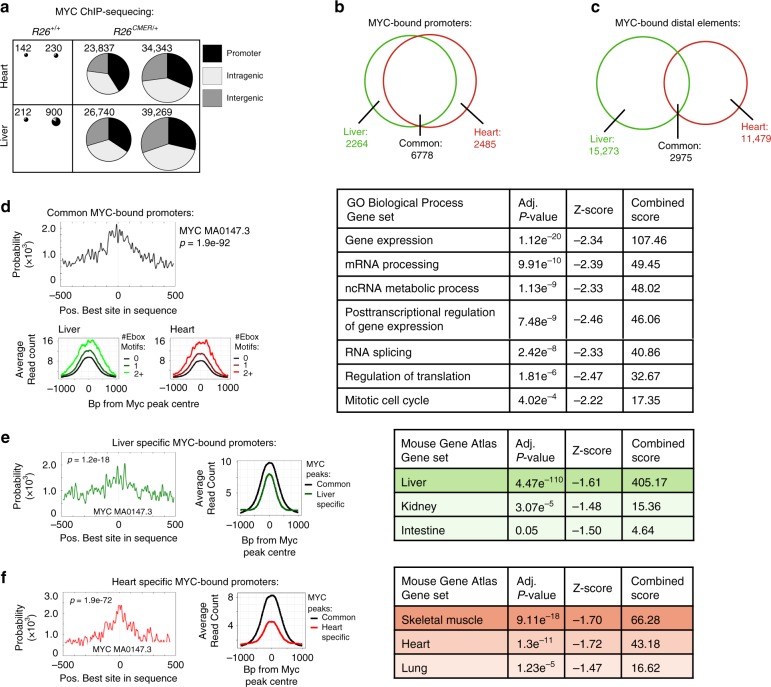
Fig. 2. Myc binding differs between tissues.
a The number of Myc peaks and their location (promoter, intragenic and intergenic). Replicates are derived from independent mice. b Venn diagram of the overlap of peaks called within promoter regions (−2 kb to +1 kb from the nearest TSS). c Venn diagram of the overlap of peaks called within distal elements. d Motif probability curves for common Myc-bound promoters show the probability of an E-box consensus sequence occurring at a given position relative to the Myc ChIP peak at each common promoter site, as determined by CentriMo (top left). Average read count of Myc peaks at common promoters containing 0, 1 or >2 E-box motifs within 1000 bp from the peak centre in liver and heart chromatin (bottom left). Selected significant GO Biological Process Gene sets that overlap with common Myc-bound promoter elements (right). e Motif probability curves for liver-specific promoters show the probability of an E-box consensus sequence occurring at a given position relative to the Myc ChIP peak at each liver-specific promoter site, as determined by CentriMo (left). Average read count of Myc peaks shown at common (black) and liver-specific (green) promoter sites (centre). Selected significant Mouse Gene Atlas Gene sets are shown that overlap with liver-specific Myc-bound promoter elements (right). f As for e but for heart-specific Myc-bound promoters bound by Myc only in the heart. Significant Mouse Gene Atlas Gene sets are shown that overlap with heart-specific Myc-bound promoter elements (right). All analysis determined by Myc ChIP sequencing performed from hearts and livers harvested from wild-type (R26+/+ n = 2) and R26CMER/+ (n = 2) mice at 4 h post administration of 4-OHT. MemeSuite Centrimo computed P-values are derived by a binomial test. Enrichr computed P-value (Fisher’s exact test), Z-score (modified Fisher’s exact test to determine deviation from an expected rank) and combined score (C=ln(P) × Z) are shown. Source data are provided as a Source Data file.

