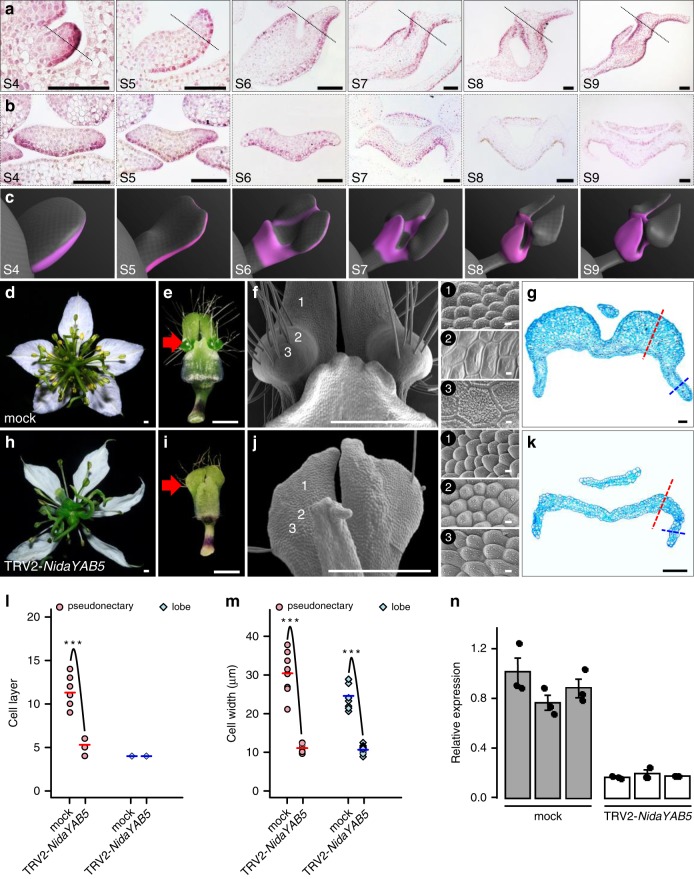
Fig. 5. Expression and function of NidaYAB5.
a, b The results of in situ hybridization of NidaYAB5 in petals. Dashed lines in the longitudinal sections (a) indicate the positions at which the transverse sections (b) were made. Scale bars: 100 μm. For a, b, the experiments were repeated three times independently with similar results. c Virtual clay models showing the expression domains (pink) of NidaYAB5 in petals. Phenotypes of the mock (d–g) and TRV2-NidaYAB5-treated flowers with strong phenotypic changes (h–k). The flowers and mature petals are shown in d, h and e, i, respectively. The micromorphology and anatomy of the pseudonectary regions are shown in f, j and g, k, respectively. 1–3 next to f and j indicate the corresponding regions on the surface of the mock and TRV2-NidaYAB5-treated petals. Red arrows point to the pseudonectary region, and dashed lines indicate the pseudonectary (red) and lobe (blue) areas at which the cell layer (l) and cell width (m) were recorded. Scale bars: d–f, h–j, 1 mm; 1–3, 10 μm; g, k, 100 μm. Comparisons of cell layer (l) and cell width (m) at the pseudonectary and lobe areas between mock and TRV2-NidaYAB5-treated flowers. Bars indicate the mean values. The asterisks indicate the significant difference by two-side Wilcoxon rank sum test (P value < 0.001) between samples. The exact P values were listed in the Source Data. Source data for l and m are provided as a Source Data file. n The results of qRT-PCR for NidaYAB5 in petals of mock and TRV2-NidaYAB5-treated flowers. Each treatment includes three biological replicates. Error bars indicate the standard deviation (SD) of three technical replicates of each biological replicate. The measure of the center for the error bars is the mean value of three technical replicates of each biological replicate. Data are presented as mean values ± SD.

