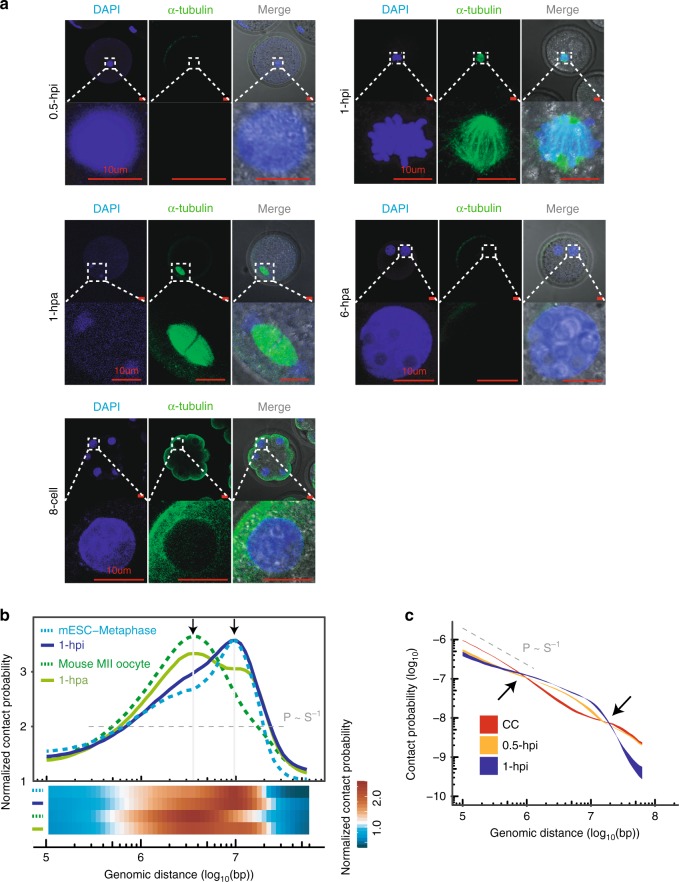
Fig. 2. Mitotic metaphase to meiosis metaphase II-like chromatin transition.
a Immunofluorescence staining of 0.5-hpi, 1-hpi, 1-hpa and 6-hpa 1-cell embryos and 8-cell embryos. DNA: DAPI (blue) and microtubules: α-tubulin (green). Scale bar: 10 μm. Data are representative of three independent experiments. b Both the curves and heatmaps showing the intrachromosomal interaction probabilities (P(s)) relative to genomic distance that are normalized by the P(s) ~ s−1 values. The peaks represent the rapid fall-off at ~4 Mb and ~10 Mb in secondary meiotic and mitotic chromatin, respectively. Source data are provided as a Source Data file. c The chromatin contact probabilities (P(s)) relative to genomic distance for CC, 0.5-hpi, and 1-hpi embryos. The P(s) ~ s−1 curve representing the predicted fractal globule state is shown for reference. The P(s) ribbon is bounded by minimum and maximum (P(s)) calculated from all replicates of Hi-C data sets. Source data are provided as a Source Data file.

