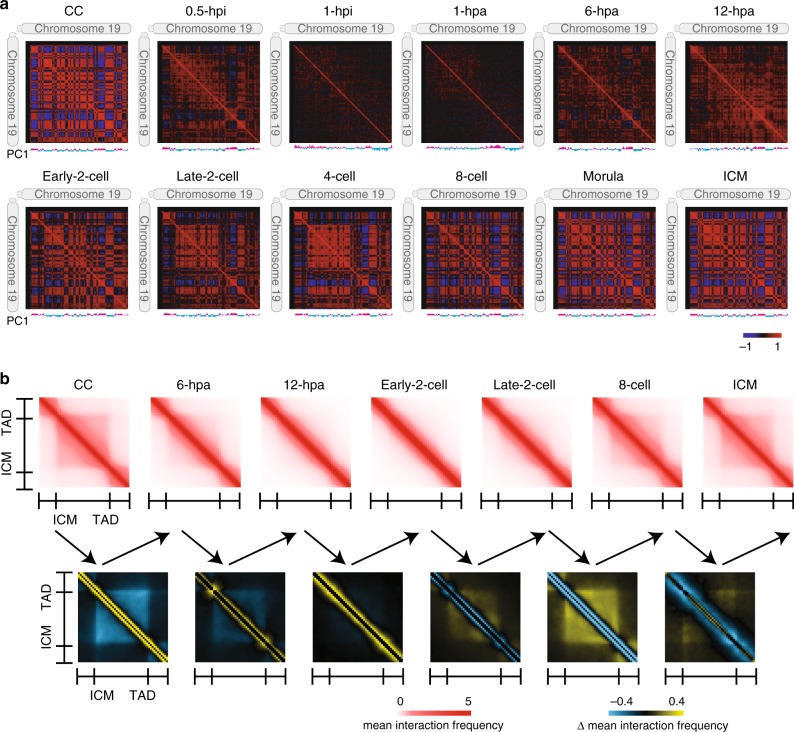
Fig. 3. Dissolution and reestablishment of 3D chromatin architecture.
a Correlations of intrachromosomal interaction frequency patterns between any two regions along chromosome 19 (300-kb bin). The first principle component (PC1) values are shown under each heatmap as compartments A (magenta) and B (cyan). b The top heatmaps show the mean normalized interaction frequencies for the TADs and their flanking regions with a TAD length of ±0.5. The TADs were defined in the ICM stage and used for all stages. The bottom heatmaps show the difference in the interaction frequencies between consecutive stages. Source data are provided as a Source Data file.

