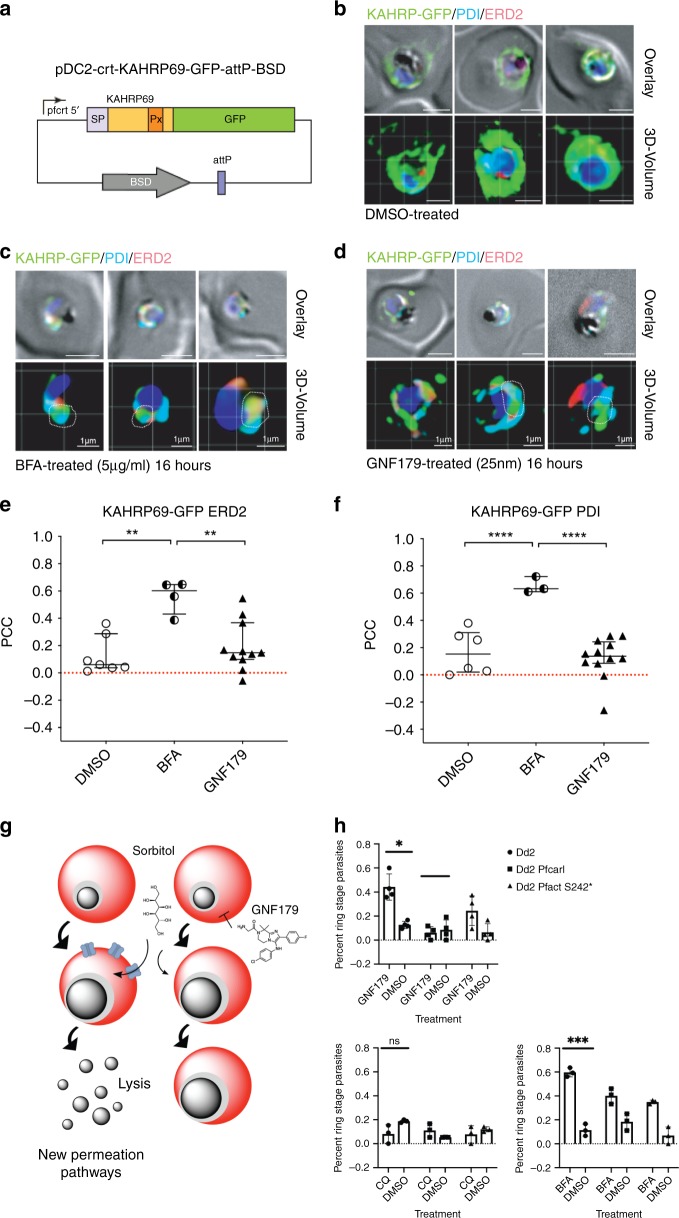
Fig. 4. Confirmation of GNF179’s inhibition of protein export in P. falciparum blood stage parasites.
a Vector used for assays shown in b–d. b–d Imaging of GFP reporter to the plasma membrane under the indicated compound treatments for 16 h. Parasites were fixed and stained with Hoechst 33342 (blue), α-GFP (green), α-ERD2 (red) and α-PDI (cyan) antibodies. Scale bars: 2 µm unless otherwise indicated. Overlay: DIC images merged with fluorescent channels. Quantification of colocalization between KAHRP-GFP and ERD2 (e), and between KAHRP-GFP and PDI (f) are indicated by Pearson correlation coefficient (PCC); Each dot represents an individual parasitized red blood cell. Statistical significance was evaluated using an unpaired, two-tailed t-test where where * is p < 0.05, ** is p < 0.01, *** is p < 0.001, and **** is p < 0.0001. g Model for establishing new permeation pathways. If proteins are not exported to the red cell where they can form new permeation pathways, sorbitol will not be imported and cause lysis. h Percentage of rings (mean ± SEM, at least three independent experiments) from an asynchronous parasite population 24 h after sorbitol synchronization, treated as indicated by GNF179 (5 nM), Chloroquine (CQ, 500 nM) or brefeldin A (BFA, 5 µM). Statistical significance was determined using a paired, two-tailed t-test where * is p < 0.05, ** is p < 0.01, and *** is p < 0.001. Dd2 pfcarl experiments were conducted with the pfcarl evolved triple mutant (KAD452-R3) and edited Dd2-ACTStop mutant. For sensitive parasites (Dd2), 25 nM of GNF179 was used, while 1 µM was used on resistant parasites. Source data for e, f, and h are provided as a Source Data file.

