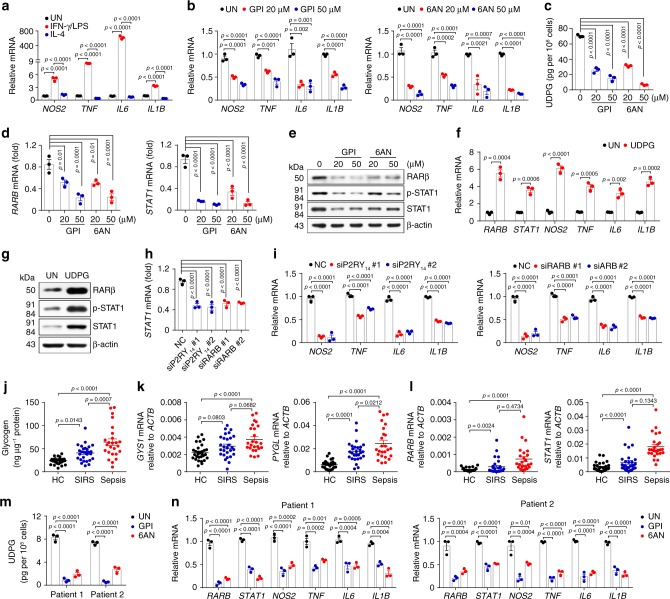
Fig. 8. Macrophage glycogen metabolism regulates sepsis in patients.
a THP-1 cells were cultured with PMA (100 ng mL−1) for 3 days and differentiated into macrophages, followed with IFN-γ/LPS or IL-4 stimulation for 24 h. NOS2, TNF, IL6 and IL1B expression was determined by real-time PCR, n = 3 biologically independent experiments. b–e PMA incubated THP-1 cells were pretreated for 30 min with GPI or 6AN prior to stimulation with IFN-γ/LPS for 24 or 36 h, NOS2, TNF, IL6, and IL1B expression was determined by real-time PCR, n = 3 biologically independent experiments (b). UDPG in supernatants was determined by ELISA, n = 3 biologically independent experiments (c). RARβ and STAT1 expression was determined by real-time PCR, n = 3 biologically independent experiments (d) and western blot (e). f, g PMA and IFN-γ/LPS-stimulated THP-1 cells were treated with or without UDPG for 24 or 36 h, RARB, STAT1, NOS2, TNF, IL6, and IL1B expression was determined by real-time PCR, n = 3 biologically independent experiments (f), RARβ and STAT1 expression was determined by western blot (g). h, i P2RY14 or RARB siRNA transfected THP-1 cells were stimulated with IFN-γ/LPS for 24 h, STAT1, NOS2, TNF, IL6, and IL1B expression was determined by real-time PCR, n = 3 biologically independent experiments. j–l Blood samples from patients with sepsis (n = 25) and SIRS (n = 28) and healthy controls (n = 30) were collected. Intracellular glycogen levels in human peripheral blood CD14+ monocytes were determined by colorimetric assay (j). GYS1, PYGL, RARB, and STAT1 expression was determined in human peripheral blood CD14+ monocytes by real-time PCR (k, l). m, n Two sepsis patients’ CD14+ monocytes were isolated and cultured with M-CSF (20 ng mL−1) for 4 days, and then treated with GPI or 6AN respectively. UDPG in supernatants was determined by ELISA, n = 3 biologically independent experiments (m) and RARB, STAT1, NOS2, TNF, IL6, and IL1B expression was determined by real-time PCR (n), n = 3 biologically independent experiments. Data are presented as mean ± SEM. P values were calculated using one-way ANOVA (a–d and h–n) and two-tailed unpaired Student’s t-tests (f).

