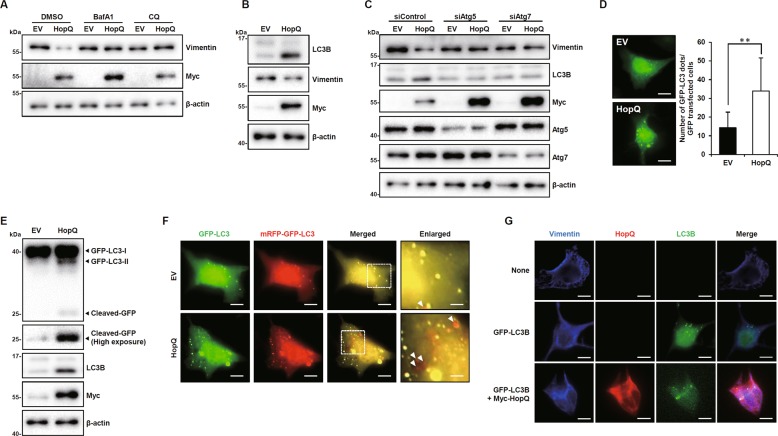
Fig. 5. HopQ mediates autophagy-dependent degradation of vimentin.
a EV or Myc-HopQ-expressing B16F10 cells were treated with bafilomycin A1 (BafA1) 10 nM or chloroquine (CQ) 20 μM for 12 h, then cell lysates were collected for immunoblot. b B16F10 cells were transfected with EV or myc-HopQ for 24 h, and cell lysates were collected for immunoblot. c B16F10 cells were transfected with EV or Myc-HopQ together with 50 nM of indicated siRNAs for 24 h, and cell lysates were collected for immunoblot. d Representative images of green fluorescent protein (GFP)–LC3 punctae in Myc-HopQ-transfected B16F10 cells. The bar graph indicates the number of GFP–LC3 dots per transfected cell. (**P ≤ 0.01). Scale bar: 20 μm. e B16F10 cells were transfected with EV or Myc-HopQ, and GFP–LC3 for 24 h, and cell lysates were collected for immunoblot. f B16F10 cells were transfected with EV or Myc-HopQ together with mRFP-GFP–LC3 for 24 h, and cells were fixed with 4% paraformaldehyde and subjected to confocal microscopy. In merged GFP and RFP images, yellow dots are visible in autophagosomes, whereas only RFP fluorescence, indicated by red punctae, is observed in autolysosomes (arrowhead). Scale bar: 20 μm. Enlarged scale bar: 5 μm. g B16F10 cells were either left untransfected or transfected with GFP–LC3B of both Myc-HopQ and GFP–LC3 for 24 h, fixed with 4% paraformaldehyde, and subjected to confocal microscopy. Scale bar: 20 μm.

