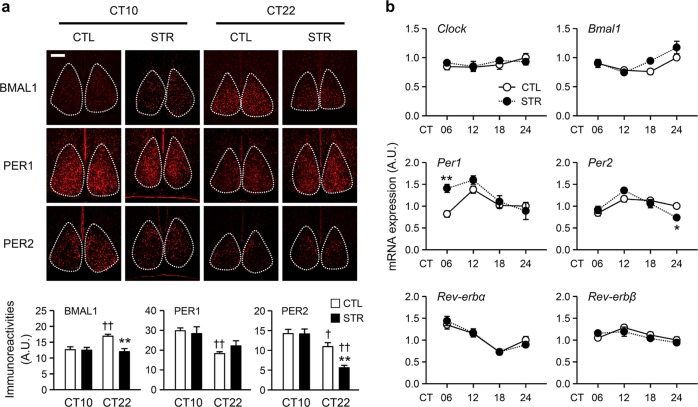
Fig. 3. Expression levels of core clock genes in the SCN of adult male offspring.
a Representative images of BMAL1, PER1, and PER2 protein expression in the SCN, which is marked by the dashed lines (scale bar = 50 µm). The fluorescence intensities of the indicated proteins in the SCN were normalized against the DAPI signal and are presented as the mean ± SE (n = 19–36 cells from three independent slices from different mice in each group; **p < 0.01 between CTL and STR at the corresponding time point; †p < 0.05 and ††p < 0.01 between CT10 and CT22 by Bonferroni post hoc comparison). b mRNA expression profiles of clock genes in SCN-AH fragments from CTL and STR mice. The data were normalized against TATA-binding protein (TBP) expression levels and are expressed as the mean ± SE in arbitrary units (A.U.), with the mean CTL value at CT24 being defined as 1 (n = 4 for each time point; *p < 0.05 and **p < 0.01 between CTL and STR by Bonferroni post hoc test).

