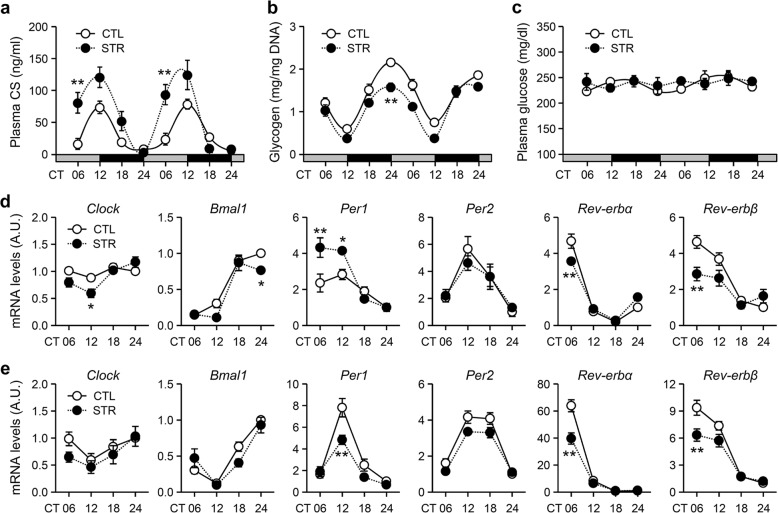
Fig. 5. Influences of maternal stress on peripheral rhythms in adult male offspring.
a Plasma CS concentration (n = 8 CTL mice and n = 6 STR mice at each point), b hepatic glycogen content (n = 7 CTL mice and n = 5 STR mice), and c plasma glucose levels (n = 8 CTL mice and n = 6 STR mice). The mice were housed under DD conditions and sacrificed at the indicated time points over a 2-d period. The data are presented as the mean ± SE in the indicated units (**p < 0.01 vs. CTL mice at the same time point by Bonferroni post hoc comparison). d, e mRNA expression profiles of clock genes in the adrenal gland (d) and liver (e). The data were normalized against TBP expression levels and are expressed as the mean ± SE in A.U., with the mean CTL value at CT24 being defined as 1 (n = 4 for each point, *p < 0.05 and **p < 0.01 vs. CTL mice at the same time point by Bonferroni post hoc correction).

