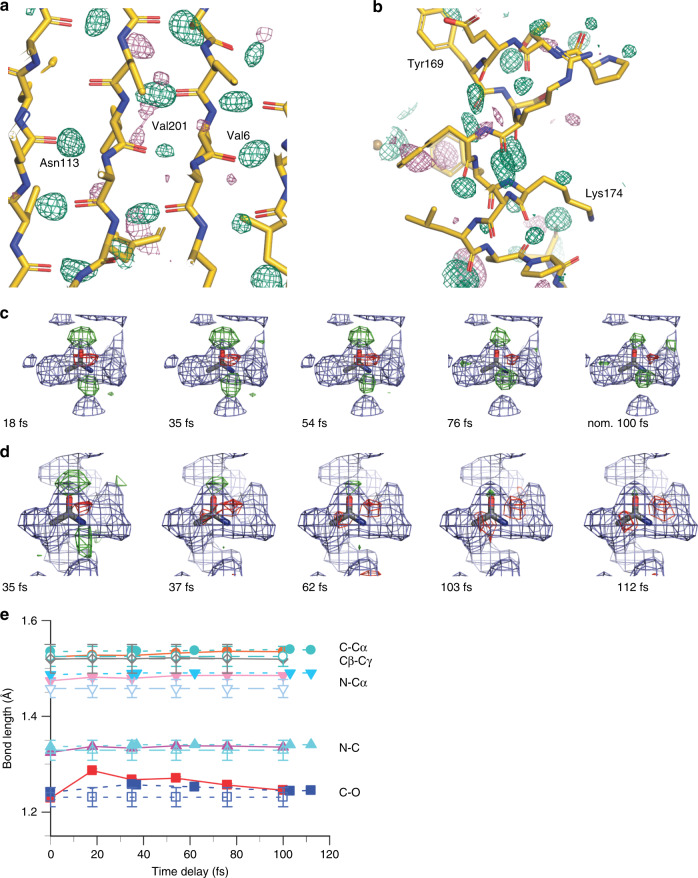
Fig. 2. Changes in the protein backbone.
a, b Isomorphous difference density map (Fobs(18fs) – Fobs(single pulse))29 of thaumatin at a contour level of +3σ (green) shows peaks close to carbonyl oxygen atoms involved in hydrogen bonds in the ß-sheet region (a) and the ɑ-helix region (b). There are fewer negative (−3σ pink) than positive (+3σ green) difference peaks. c, d Isomorphous difference density maps (Fobs(Δt)–Fobs(single pulse)) of thaumatin (c) and lysozyme.Gd (d) averaged over all peptide bonds shows also negative peaks (−3σ (red) and +3σ (green)). Both proteins show the effect, but it is less dependent on the delay time in case of lysozyme.Gd. This may be due to data quality; the lysozyme.Gd data deteriorate much faster than those of thaumatin (Supplementary Figs. 2–4, Supplementary Tables 1 and 2). e Refined bond lengths of the peptide bonds in lysozyme.Gd (blue filled symbols) and thaumatin (red filled symbols). The bond lengths are average values of 100 independently refined structures using a jackknife approach. The values of standard bond lengths60 are displayed using open symbols.

