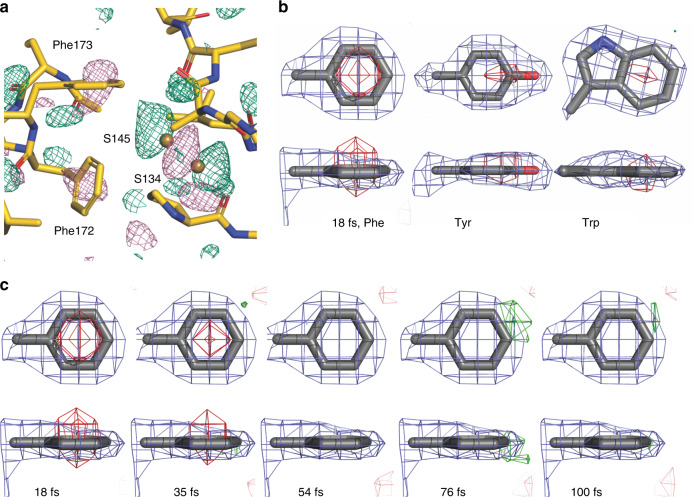
Fig. 3. Changes in aromatic side chains.
a The isomorphous difference electron density map (Fobs(18fs) – Fobs(single pulse))29 of thaumatin shows peaks (−3σ (pink) and +3σ (green)) in the center of phenyl rings. In addition, there are changes around the adjacent elongated Cys145-Csy134 disulfide bridge and the backbone carbonyl oxygen atoms. b Averaged difference density (18 fs time delay point) of all phenylalanines (11), tyrosines (8) and tryptophan (3) side chain in thaumatin. c The difference electron density maps averaged over all phenylalanine residues shows that the negative difference is highest after 18 fs and no longer visible at 54 fs. It is unclear whether this latter observation is an effect of data quality.

