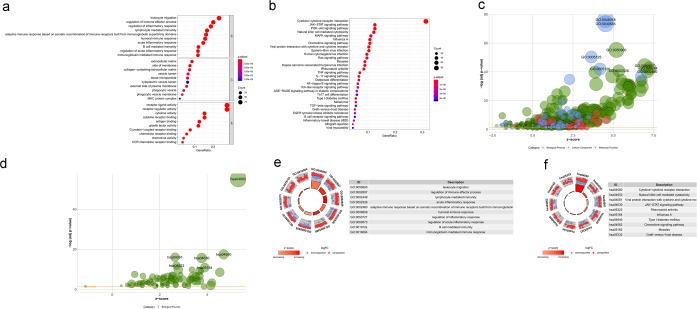
Figure 2.
Gene functional enrichment of differentially expressed immune-related genes. Differentially expressed IRGs identified via Gene Ontology (GO) (a,c) and KEGG pathway (b,d) analyses. In the bubble plot (c), green, red and blue bars represent biological processes, cellular components and molecular functions, respectively. The top 10 most significant GO terms (e) and Kyoto Encyclopedia of Genes and Genomes pathways (f). Nodes in the concentric circle graph represent co-expressed genes clustered in specific biological process terms. The inner sectors with larger size and darker color represent more significant enrichment.

