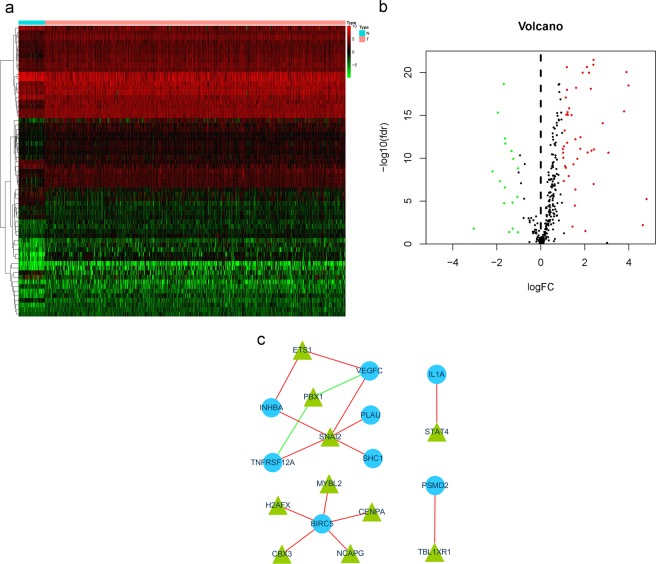
Figure 6.
Differentially expressed transcription factors (TFs) in the differentially expressed genes between HNSCC and nontumor patients. (a) Heat map and (b) volcano plot demonstrating differentially expressed TFs. Red represents upregulated differentially expressed TFs, blue represents downregulated differentially expressed TFs, and black dots (volcano) represent TFs that were not differentially expressed. (c) Differentially expressed TFs and the high-risk survival-associated IRG interaction network. The red line represents positive regulation, and the green line represents negative regulation.

