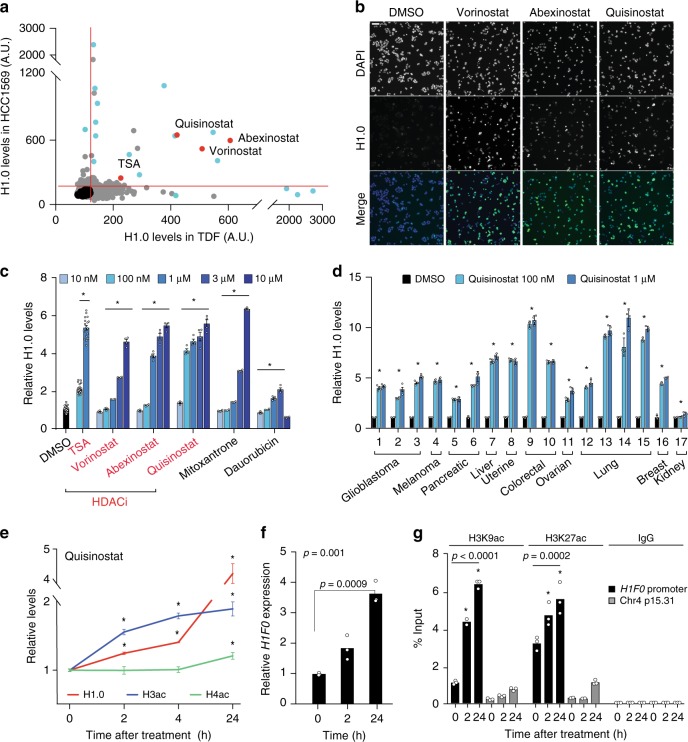
Fig. 1. HDAC inhibitors restore high levels of H1.0 in a large panel of cancer cell lines.
a Immunofluorescence microscopy quantifying H1.0 levels in the screen. Each dot represents the median value for each compound (n = 3 biological replicates). Black: DMSO, blue: compounds tested for validation, red: HDACi. b Representative images from one of three HCC1569 biological replicates from the screen. Scale bar: 50 µm. c Validation experiments in HCC1569 cells. Values represent mean ± s.e.m. from four biological replicates for each condition, except DMSO (n = 48), 100 nM TSA (n = 24) and 1 μM TSA (n = 18). *p-value < 0.0001 (one-way ANOVA) for each drug titration compared to DMSO. d Immunofluorescence microscopy quantifying H1.0 levels 24 h after Quisinostat treatment in cell lines from the indicated cancer types (cell line names listed in Supplementary Table 1). Values represent mean ± s.e.m. from four biological replicates. *p-value < 0.0001 (one-way ANOVA) comparing DMSO- and Quisinostat-treated cells. e Immunofluorescence microscopy quantifying levels of H1.0, acetylated H3 (H3ac) and acetylated H4 (H4ac) at the indicated times after 100 nM Quisinostat treatment of HCC1569 cells. Values represent mean ± s.e.m. from eight (H1.0) or four (H3, H4) biological replicates. *p-value < 0.01, compared to 0 h (one-tailed Student’s t-test). Exact p-values in Source Data file. f qRT-PCR quantifying H1F0 expression levels in HCC1569 cells at the indicated time after treatment with 100 nM Quisinostat. Values are mean from three technical replicates. p-values: one-way ANOVA comparing untreated and treated (value on top) followed by Dunnett’s test (value above line). g ChIP-qPCR analysis of the acetylation status of the H1F0 promoter and of a control region at the indicated times after 100 nM Quisinostat treatment. Values are mean from three technical replicates. Data are shown as relative to 1% of input. The significance of the differences between treated and untreated cells is indicated for each antibody for the H1F0 promoter samples (one-way ANOVA, followed by Dunnett’s test). *p < 0.001. Exact p-values in Source Data file. Data for all graphs in Source Data file.

