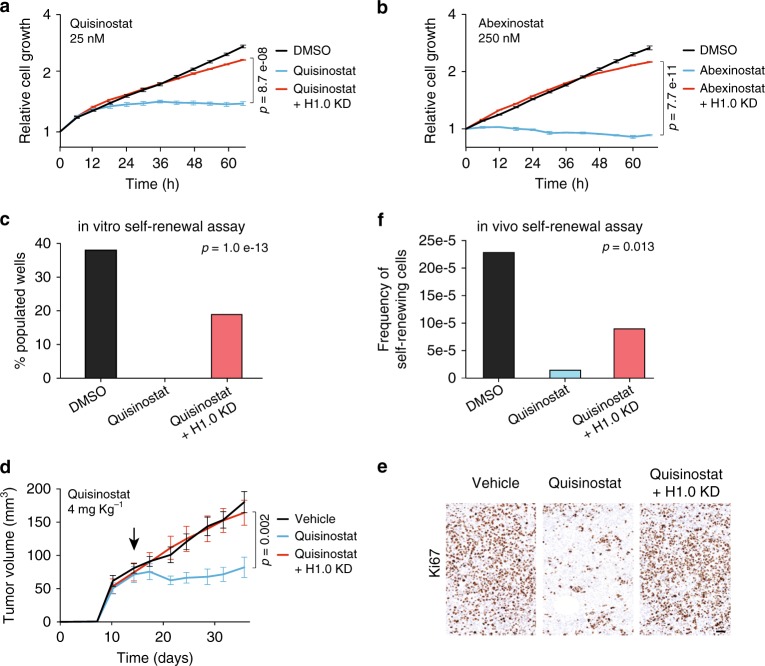
Fig. 4. Quisinostat inhibits cancer cell self-renewal by restoring high H1.0 levels.
a, b IncuCyte proliferation assay on HCC1569 cells treated with the indicated HDACi. HCC1569 cells used in these experiments contain an inducible H1.0-targeting shRNA (shH1.0_1), which is either not expressed (Quisinostat/Abexinostat) or expressed to prevent H.10 upregulation (Quisinostat/Abexinostat + H1.0 KD). See also Supplementary Fig. 5e, h (independent H1.0-targeting shRNA and a non-targeting shRNA). Values represent mean ± s.e.m. from four biological replicates. Similar results were obtained in three independent experiments. p-value: one-tailed Student’s t-test calculated at the last time point. c Clonogenic assays measuring self-renewal ability of HCC1569 cells. The percentage of wells (n = 96) populated by colonies is shown. Cells contain an inducible H1.0-targeting shRNA (shH1.0_1) which is not expressed (Quisinostat) or expressed to prevent H1.0 upregulation (Quisinostat + H1.0 KD). Cells were treated with 12.5 nM Quisinostat with (H1.0 KD) or without 0.5 µg ml−1 Doxycycline. With DMSO-treated H1.0 KD cells, the percentage of populated wells was 39.6%. The significance of the overall difference among the conditions is indicated (three-way contingency table analysis and two-tailed Fisher’s exact test). d Tumor maintenance assay. Growth kinetics of HCC1569-induced tumors treated with 4 mg kg−1 Quisinostat or vehicle. Injected cells contain an inducible H1.0-targeting shRNA (shH1.0_1) which is either not expressed (Quisinostat) or expressed to prevent H1.0 upregulation (Quisinostat + H1.0 KD). Values represent mean ± s.e.m. from eight tumors. p-value: one-tailed Student’s t-test calculated at the last time point. Arrow: start of treatment. Similar results were obtained in an independent experiment. See also Supplementary Fig. 5k. e Immunodetection of proliferating (Ki67+) cells by immunohistochemistry in one of three tumors per condition. Scale bar: 50 µm. f Limiting-dilution transplantation assay into NSG mice using cells from HCC1569-induced tumors treated with the indicated substances. The significance of the overall difference among the conditions is indicated (χ2 test). n = 6 tumors. Outgrowths/injections for H1.0 KD: 4/6, 0/6, 0/6 and 0/6 for 10,000, 1000, 100, 10 injected cells, respectively. For the other conditions, see Fig. 2g. Data for all graphs in Source Data file.

