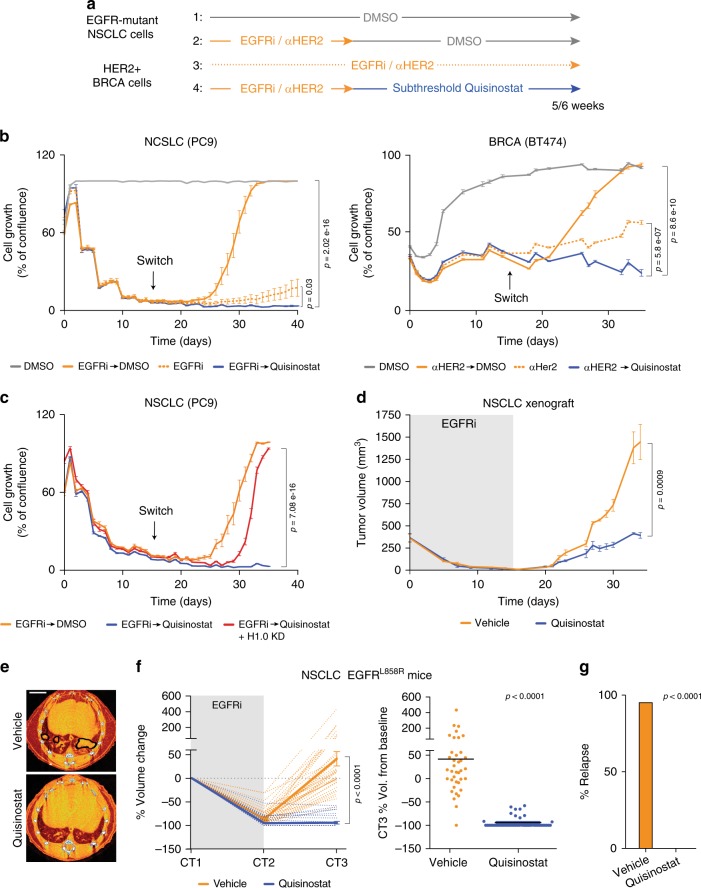
Fig. 6. Quisinostat treatment inhibits expansion of cells surviving targeted cytotoxic agents.
a Experimental design to assess the effect of Quisinostat on cells surviving EGFRi and anti-HER2 antibody (αHER), showing conditions tested in b. Subthreshold Quisinostat dose: 10 nM after 14 days of targeted therapy (switch). b IncuCyte proliferation assay on EGFR-mutant non-small lung cancer (NSCLC) PC9 cells and breast invasive carcinoma (BRCA) BT474 cells. The line steps correspond to media change time points. Values represent mean ± s.e.m. from five biological replicates. Similar results were obtained in multiple experiments. p-value calculated at the last time point (one-tailed Student’s t-test). c IncuCyte proliferation assay on PC9 cells containing an inducible H1.0-targeting shRNA (shH1.0_1) which is either not expressed (Quisinostat) or expressed to prevent H1.0 upregulation (Quisinostat + H1.0 KD). Values represent mean ± s.e.m. from five biological replicates. p-value calculated at the last time point (one-tailed Student’s t-test). d Growth kinetics of tumors induced by injection of EGFR-mutant NSCLC H1975 cells. Sequential treatment with osimertinib (gray area) and Quisinostat or vehicle. Values represent mean ± s.e.m. from four tumors. p-value calculated at the last time point (one-tailed Student’s t-test). Similar results were obtained in two independent experiments. e Representative CT scans (CT3) of EGFRL858L mice treated with vehicle or Quisinostat after EGFRi treatment (Erlotinib) and quantified in f. Black lines: detected tumors. Orange areas: bronchi and blood vessels. Scale bar: 4 mm. f Response to sequential EGFRi-Quisinostat therapy in EGFRL858L mice, expressed as percentage of tumor volume change relative to the start of treatment (left) and at endpoint (right). Sequential treatment with EGFRi (gray area) and Quisinostat or vehicle. CT scans performed at 1 month intervals. Dotted lines: individual tumors; solid lines: average values ±s.e.m. (left). Each dot is an individual tumor; black line: mean value (right). n = 38 for vehicle, 41 for Quisinostat. p-value: two-tailed Mann–Whitney test. Vol: Volume. g Percentage of relapsed tumors at endpoint. n = 31 for vehicle and 21 for Quisinostat. Only tumors undetectable at CT2 are scored. p-value: two-way contingency table analysis and two-tailed Fisher’s exact test. Data for all graphs are in Source Data file.

