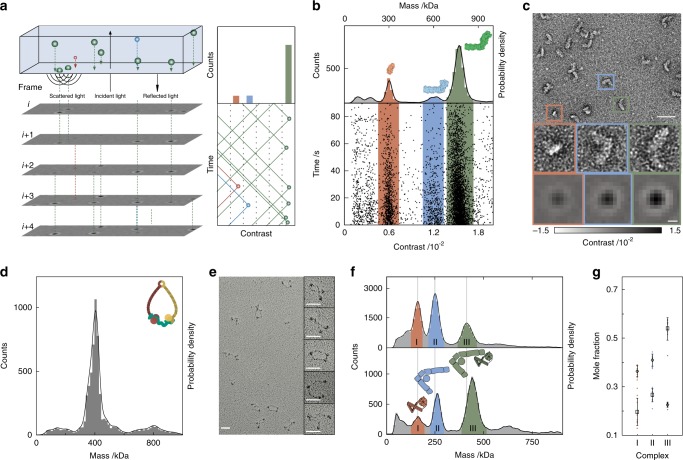
Fig. 1. Mass photometry as a general method for characterizing biomolecular heterogeneity.
a Principle of operation based on interference between scattered and reflected light combined with ratiometric imaging. b Scatter plot of binding events for NADH:ubiquinone oxidoreductase (respiratory complex I, 12.5 nM), and the corresponding mass histogram. c Negative-stain micrograph of the same sample with individual species corresponding to the peaks in b highlighted. MP images of species with the respective mass are shown for comparison. Scale bars: 50 nm (nsEM) and 200 nm (MP). d Mass distribution for 21 nM trimeric cohesin; upper right, cartoon of trimeric cohesin. e Rotary shadowing EM micrograph of trimeric cohesin shows intrinsic conformational flexibility. Scale bars: 50 nm. f A mixture of two interacting NPC-I and II subcomplexes before (top) and after (bottom) chemical crosslinking with 0.1% glutaraldehyde for 5 minutes followed by quenching. g Reproducibility of the crosslinking procedure shown in f in terms of mole fractions of the three main species before (diamonds) and after crosslinking (rectangles). Source data are provided as a Source Data file.

