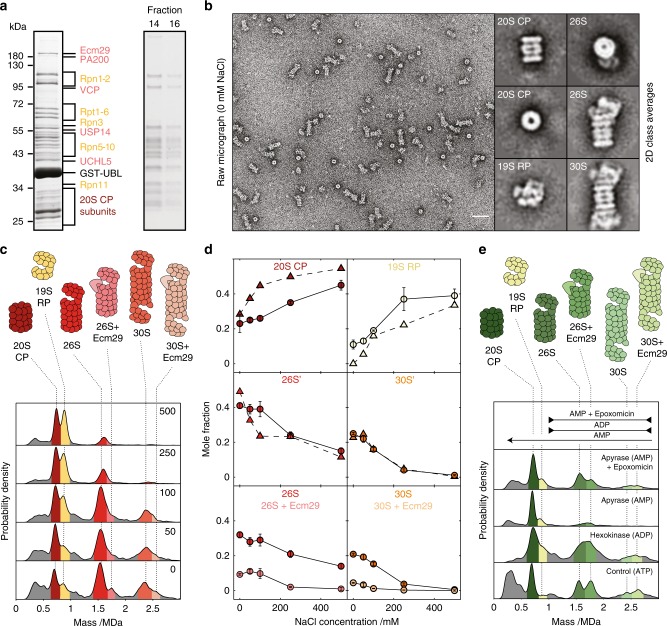
Fig. 3. Proteasome composition, structure, stability, and interactions.
a SDS-PAGE gels of two-step affinity purification of proteasomes—pull down with GST-Ubl (left) and separation on 10–30% sucrose gradient (right). Individual proteasome subunits are shown in dark red and yellow and PIPs in pink. b Representative negative-stain micrograph and 2D class averages of proteasome complexes generated by nsEM analysis. Scalebar: 50 nm. c MP distributions as a function of NaCl concentration. All reactions were carried out at 4 °C. d Corresponding changes to the abundances of the main species comparing nsEM (triangles) with MP (circles) as well as a breakdown of the main 26S and 30S (dark) and Ecm29-bound (light) species. Error bars are calculated as the standard deviation of mole fractions from different repeats. e MP distributions as a function of different nucleotide conditions. All reactions were carried out at 37 °C. Source data are provided as a Source Data file.

