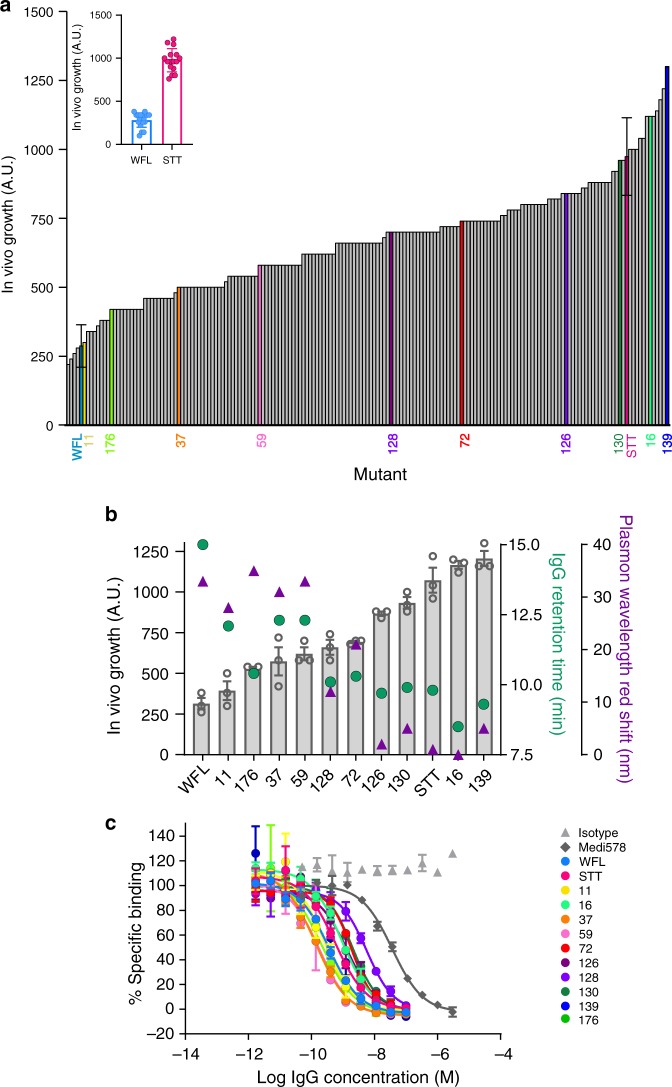
Fig. 3. In vivo growth score of evolved βLa-scFvWFL variants and the aggregation propensity and target affinity of ten selected variants in IgG1 format.
a Ranked in vivo growth score of 185 variants (Inset shows error for controls βLa-scFvWFL and βLa-scFvSTT, data represent mean values ± s.d. (n = 15 biological repeats)). Ten variants across the rank (11, 176, 37, 59, 128, 72, 126, 130, 16 and 139) were selected and reformatted as full-length IgG1s for biophysical analysis. b HP-SEC retention time (green dots, longer times indicate greater interaction with column matrix) and AC-SINS (purple triangles, larger plasmon shifts correlate with greater self-association. n = 3 technical repeats. Note: error bars smaller than symbols (mean values)) of the ten selected variants in IgG1 format. These data correlate inversely with in vivo growth score (grey bars represent mean values, error bars represent s.e.m. n = 3 technical repeats). c Data used to calculate the IC50 values of binding of the ten evolved variants in IgG1 format to NGF determined using a homogeneous time-resolved fluorescence assay (HTRF). Data represent mean values ± s.d. (n = 3 technical repeats). Source data are provided as a Source Data file.

