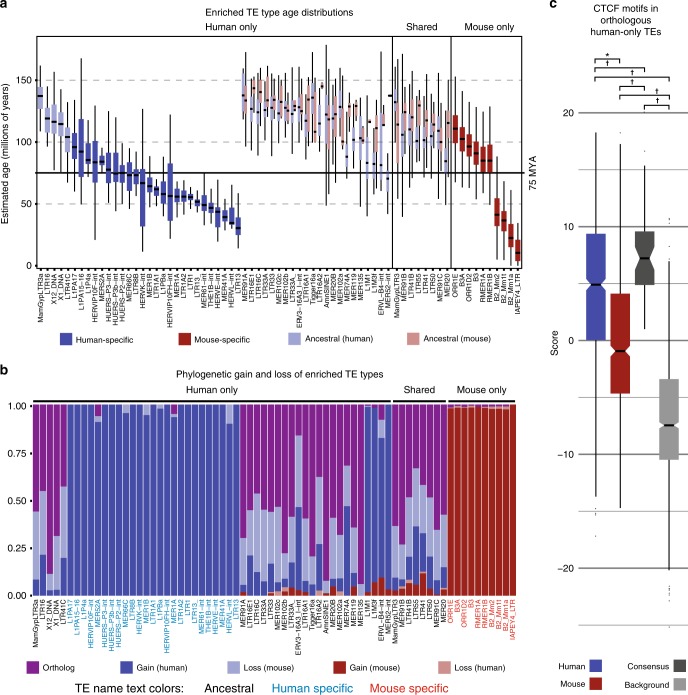
Fig. 3. Ages and phylogenetic histories of human-only CTCF-enriched TEs support mouse-specific loss-of-function.
a Estimated age distributions for CTCF-bound TE insertions of enriched types. Colors indicate the species-specificity of each TE type and score distributions are split by species where applicable. The solid black horizontal line marks the estimated primate–rodent divergence date. b Fraction of enriched TE insertions inferred as orthologous, or as evolutionary gains or losses on a given branch of the phylogeny. TE label colors indicate whether the given type is ancestral (black), human-specific (blue), or mouse-specific (red). c Maximum CTCF motif scores within human and mouse instances of ancestral, human-only TE types. TE Consensus sequences (a proxy for the ancestral TE sequence, dark gray) and length-matched background sequences (light gray) are shown for comparison. Log-odds scores greater than 1 indicate sequences matching the CTCF motif more than expected by chance. Hypothesis tests were used to assess significance of differences in all pairwise comparisons: *p < = 2.9e−58 (one-sided Wilcoxon signed-rank test), †p < = 2.6e−4 (one-sided Wilcoxon rank-sum test). Human, n = 852; mouse, n = 852; consensus, n = 54; background, n = 852. Boxplots in a and c are centered around the median, with upper and lower hinges, indicating the first and third quartiles. Upper and lower whiskers extend from the hinge to the largest and smallest values within 1.5× the inter-quartile range from the hinge. Individual data points beyond the ends of the whiskers represent outliers.

